From the cumulative frequency graphs I can make a visual representation of the Upper quartile, Lower quartile and median by plotting a box plot using the data from the cumulative frequency. This method makes it much easier to make comparisons and contrasts.
The Times had a median of 4 The Journal had a Median of 4.4 and The Daily Mirror had a median of 3.3. This surprised me because I would have expected The Times to have a bigger median but a 30 word sample is not bigger enough to make a full conclusion on it. It is the middle number from the cumulative frequency graph and is not affected by extreme data. This means that that half the distribution is under 4 words for The Times and 4.4 for The Journal and 3.3 for The Daily Mirror. Although The Journal had a bigger median the IQ for The Times was 3.7 The Journal was 2.8 and The Daily Mirror was 2.6. The IQ represents 50% the data and it happens to be in the middle half and the distribution. So 3.7 are in the 50% middle range of the distribution. Although the IQ is bigger in the Times meaning it varies more often it has a big UQ and LQ so although the range is smaller the word length is also. The Average letter length for a word in The Times is 4.4, 5 for the Journal and 3.8 for The Daily Mirror mean the general word to come up is 5 for the Journal which is unexpected but its only a 30 word sample so making an assumption is hard to make because the sample isn’t big enough so therefore I shall start on a study of 100 words.
Analysis
In this investigation I have included names hyphenated words and apostrophes as it still think its part of the same word and relevant to the newspaper article plus everyone has to read the names and other words so not including them would make the analysis unfair.
Word Length
I counted a hundred words sample of a sports article in The Times, The Journal and The Daily Mirror. I decided to do individual data first just to make it accurate I can always group it later for Cumulative Frequency and Boxplots.
Before I collected the data on word length my expectations were that The Times would have a longer mean word length and The Daily Mirror to have the shortest. I collected the data in a table first in individual data to make the data accurate then I used the ranges 1-3, 4-6, 7-9, 10-12 and 13-15 to group the data. I used these because it represents what I think are small words average words and bigger words. I then used this grouped data to from a cumulative frequency graph showing the UQ, LQ and the median. With the Data for each newspaper UQ, LQ and median I used it to plot a box plot of the information to make comparisons and contrast easier to make as box plots are more graphical. From the box plots I can compare and contrast easily.
The Times has a much higher median compared to The Daily Mirror of 4.3 to 2.8 this shows that the Times has generally has a higher set of numbers compared to the Daily Mirror. It also means that 50% of the data is fewer than 4.3 for the times and 2.8 for the Daily Mirror. From that data it seems clear what newspaper uses more sophisticated language. The Times LQ is higher than the Journal and The Daily Mirror and so is the Times UQ this means that the range of word length is higher than the Journal and The Daily Mirror without the extremes. The Daily Mirror median is 2. 8 much lower than the Journal and The Times meaning the word length is generally lower also the The Daily Mirror’s UQ and LQ is lower than the Journal and The Times this suggests the range of word length is lower. The IQR is not affected by extremes and shows the densest data. The Times and The Journal’s IQR are the same the UQ and LQ the Journal is smaller than The Times the difference is the same showing us that The Journal can have use sophisticated language as well as entertaining.
The Times had a mean word length of 5.17 the sun having a much lower average of 3.69 and The Journal having an average of 5.12. The Journal was much higher than I expected. This tells me that The Times generally have a greater word length overall the mean is affected by extremes.
Most of the words counted in The Daily Mirror were in the 1-3 letters section and having most the words counted below the 7-9 range letters out of the three newspapers. The Journal had the most words in the 10-12 section with 7 and The Times having 5 in the 10-12 section. The Journal also had more words in the 4-6 than The Daily Mirror which had 32. The Times had the most words in the 7-9 with 26 The Journal having 18 and The Daily Mirror having 7.
In The Daily Mirror it only had 1 word in the 10-12 letter range out of the three papers. The Daily Mirror had the most words in the 1-6 range (split into two ranges just counting them both) than any of the other papers with 92/100 words and The Times had the most words in the 7-15 range with 31 the Journal had over 70/100 words in the 1-6 and in the 7-9 range 26. The Journal both having lots of small words and more sophisticated words whereas The Daily Mirror having lots of small words and very few sophisticated words.
The Times had by far the highest amount of words in the 7-9 range it is the only people that doesn’t decline suddenly from 4-6 to 7-9 as much as the other two papers.
Sentence Length
At the start of this strand of investigation, I expected The Times to have the longest mean sentence length and The Daily Mirror to have the shortest mean length. This turned out to be the case; The Times had an average of 24.45 and the Daily Mirror having an average of 18.71. The Journal didn’t have a significant difference, 19.91.
I think this is the best indicator of which newspapers has the longest or shortest sentences. I could have used different averages but I didn’t because the mean gives you a much better general justification of what newspaper has the longest sentences within an article. I decided to show the info by a histogram because it shows the data in the most visual way and it also makes comparisons easier to make.
The Histogram shows that the times had the most number of sentences in the 41-47 words range and the 48-54 range. The Times had the same amount of sentences in the 6-12 and the 20-26.
The Journal had the highest sentence with one sentence in the 55-60 range. It had the highest number of sentences in the 6-12 with 7 sentences. In the first three ranges 1-5, 6-12 and 13-19 already half of the sentences were counted. It had no sentences in the 48-54 range.
The Daily Mirror was the only newspaper to contain no sentences in the 41-47, 48-54 and 55-60 range. More than half of the sentences were counted in the first four ranges 1-5, 6-12, 13-19, 20-26. This indicates a small average. Looking at the word length I would assume The Times was the most intellectual newspaper and the daily mirror is the least intellectual paper. The Journal would be somewhere near the times than the Daily Mirror as it informs and entertains as I will show later on.
Front-page Analysis
For this strand of investigation.I expected the Daily Mirror to have lots of pictures and little text which I was correct. As the daily mirror has 3.14% of text on the front-page. I expected the times to contain very little pictures and lots of text which I was as of 25% was text and 18% was relevant pictures to the news on the front-page. The Daily Mirror had 20% pictures.
I measured the Frontpage in mm to make is more accurate and measured the total surface area headlines, newspaper headline, pictures, advertisement, text and blank space. I then took the percentages of the front page and put it into a pie chart. I put it in a pie chart because it is visually easier to see the percentage of each part of the pie chart as I coloured in the different areas to distinguish the different parts of the front page. All the pie charts had a radius of 4cm. The front page is what people see before people buy it so the difference in the newspaper front page shows us the readability from what the people would expect to see by the amount of pictures and etc.
The Times had very little advertisement and surprisingly The Journal had 16% advertisement which is a lot higher than the daily mirror surprisingly. In the Daily Mirror most of the space was taken up by black space with the pictures and blank space combined taking up more than half of the front-page.
In the Journal the contents, blank space and advertisement takes large amounts of the front-page up. There was more advertisement than both papers. There isn’t much text on the front-page. This implies both the journal and the Daily Mirror use advertisement and pictures to attract their readers rather than inform people of the news. The contents are a big indication of trying to get readers to see inside the newspaper.
The Times had the largest amount of text and informative news. There was also a lot of space taken up by pictures but a large blank space suggest the times is not intended to pack lots of information on the front page to attract their readers. The Times also was has a smaller contents than the journal suggesting that the front page is read like any other page in the newspaper. Its principals are to inform the people on serious issues.
There is a definite contrast between the 4 newspapers as the journal and the dm seem to have less blank space showing they try to force as much info as they can on the front page yet ironically much of it isn’t news. The headlines are bigger as they are designed to catch the eye of potential readers and there are a lot of pictures to give a brighter more attractive look. The newspapers names are larger the reader can find what the want easily. The Times concentrates on giving the news without graphics to attract the reader and seems to only use pictures to illustrate the news.
Distribution of the whole paper
For this strand of investigation I expected the Daily Mirror to content more entertainment news than the other two. This proved to be correct. The Times had more political news as I expected and the journal had more sports news than the times and the Daily Mirror.
I went through the 3 newspapers and counted how many articles are dedicated to the chosen newspaper. They were divided into politics, general, entertainment, sports, royal, and features, business and debates news. I used these headings because it covers all the news in a day without leaving any articles not getting included. From this I can see what articles are dedicated to each newspaper easily. The Times is dedicated to politics and debates the Journal is dedicated to sport and the Daily Mirror is dedicated to entertainment. I am analysing the sports article I will do a word length analysis on politics to see how sophisticated the words are in a political articles based on a 100 word sample. I would expect the political word length to have similar results but more pronounced in the political analysis. I use pie charts instead of any other method because it shows the percentage difference graphically so it makes comparisons and contrasts easier to make.
None of the newspapers contained any royal news which didn’t surprise my as the royal news isn’t really that appealing. More than a quarter of the journal was sport at 27% and surprisingly the times and the Daily Mirror having the same amount of sports related articles. I would have thought the Daily Mirror would focus in on entertaining rather than to inform sports.
The Journal had the most general news than the times which was unexpected as I would have thought the journal would be more dedicated to sport as it’s a local paper.
The Daily Mirror had more business news than political news and the entertainment news outweighed the rest of the paper. The most space was on general news and least was politics and business news as I expected.
The times had the most features including in the T2 than the other two papers and less entertainment and sport than the others two newspapers. There was more general news than the Daily Mirror but less than the Journal even though it is considered to be a more quality newspaper. Overall the times is more decided to politics and general news whereas the daily mirror is more dedicated to the entertainment news and celebrity scandals. The journal seemed to concentrate on sport to a further degree than the other two but also there was a lot of general news.
Cost Analysis
In the cost investigation I found that the Guardian, the Daily Telegraph and the Independent were the most expensive papers all at 60p. The Daily Mirror and the Chronicle were the cheapest at 35p. The Journal was also quite cheap at 40p.
This information is very misleading as the size of the paper isn’t included and neither is the readability taken in account for.
To make this strand of investigation workable I decided to do a scatter graph to formulate any correlation between price of newspaper and how many pages available. The scatter graph shows no correlation although certain factors need to be taken in account for. For example the Times, the Times have undergone recent changes in the way the paper is looked at. The change is going from broadsheet to compact size this could be an attempt to grab the attention of readers that haven’t appealed to the broadsheet before. This is seen as an anomalous result on the scatter graph.
As it costs more than other compact sizes but still has the same amount of news as the broadsheet. The guardian has double the amount of pages than the other two broadsheets. Although the Guardian has information was recorded on a Friday where they have the G2 supplement containing fashion, style, health and political opinion rather than political fact.
There were 2 clusters formed on the scatter graph, popular press and broadsheet. There is no line that can be made to make an equation between broadsheet and popular press. There is a big difference between clusters in price and page taken into consideration of the actual size of the papers. The price you pay depends on the quality of the newspaper and what information you want to be informed about. Considering the size it was almost impossible to come to a conclusion of what is the best quality. As the ratio between picture, text and adverts are varied massively. If I was to investigate this further I would take the SFA of the papers and compare it to the price. Unfortunately due to time constraints I would not be able to follow this up.
Conclusion
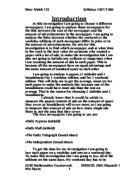
Using all my strands of investigation I feel I can conclude a number of conclusions.
The Times has a higher sentence mean and word length mean suggesting it is aimed at people of a higher IQ and uses of words more sophisticated language and longer sentences. It suggests that the readability index is higher, and the reading ages of its readers are higher. The FrontPage analysis suggests the editor is selling the newspaper for news and not simply because they want pictures to catch the readers eye. They are probably relying on the reputation of producing a quality newspaper to sell papers rather than getting the latest story. It tends not to show what’s inside of the paper but concentrates in detail the news of that day.
It is the most expensive paper which again suggests that the quality is going to be high and justifies its high price. This is demonstrated by the detailed coverage and concentrate of serious news.
The Times also indicates more political news stories, less entertainment news again suggest a target audience of a higher IQ. There are fewer features suggesting its read for in-depth news rather than entertainment.
Overall throughout the investigation I have found out that The Times is the highest quality newspaper of the three and probably is regarded as such by the majority of the British public.
The Journal also has a quite high word length but its sentence length isn’t which shows me it’s neither a tabloid nor a broadsheet but combines both features. This made sense as it focuses on regional news and therefore it has to appeal to a wide rang of IQ’s. It seeks to inform and entertain in equal measures. The front page analysis is very similar to a tabloid in its design to catch the reader’s eye. It has a relative big headline to entice the reader and contains a small amount of text on the front page.
It’s a relatively inexpensive paper yet it seems good value for money it has a high word length but the sentence length is tabloid like the daily mirror it includes more news than the daily mirror yet it is only 5p more.
The Distribution of the whole paper is biased towards sport as it is the North-East, The North-East being associated with football and the local paper reflects that. There are also a lot of general news as well as feature meaning its purpose is to inform and entertainment. In general the journal was a more accessible newspaper and seemed to bring the news out at a level where the reader doesn’t feel patronised. The journal was more towards the broadsheet although it contains a lot of features.
The Daily Mirror has the lowest mean sentence and word length suggesting it is aimed at people of a lower IQ, reading age or people with a short attention span. It also suggests that the Daily Mirror is to entertain rather than to inform on a political situation.
The FrontPage is filled with advertisement and pictures to appeal to the reader to catch the eye of the reader. It is the cheapest paper of the three it contains the least amount of news and has the lowest sentence and word length so the prices seems to be about right for what it contains.
Of the three newspapers analysed in this project, the daily mirror contained the most entertainment news and lots of features which supports the point of tabloids like the daily mirror are more for finding out about celebrity news and being entertained rather than to be informed. Overall The Daily Mirror is not intended for intellectuals and is aimed to entertain rather than to inform.
I found out that doing a sports article might give me results that give a certain conclusion but a lot of sophisticate language isn’t used and therefore I have to look else where to get a better representation of what seems easier to read. I have decided to further my study by doing another strand of investigation on the word length of a political issue.
Political Word Length Analysis
I am going to take a 100 word sample of a political word length because the sports analysis shows the minimum difference between the papers and hopefully the politics word length will show me better results. I counted the data individually to make it more accurate then group it for a cumulative frequency graph. I used the ranges 1-3, 4-6,7-9,10-12,13-15 in my grouped data because it shows short words average words and longer words. I grouped the data in them ranges and created a table. I then used the information to create a cumulative frequency graph by adding up the frequencies. I then plotted it on a graph and worked out the UQ, LQ and median from it. I then collected the data for the UQ, LQ and median on the graph to use on a box plot as it gives a much better way of comparing and contrasting. I worked out the IQR by taking the UQ from the LQ. With this information I am able to plot a box plot. Once the box plots were plotted I used them to make comparisons.
I expected the median of The Times to be higher because I expect it to use bigger words, I expect the The Daily Mirror to have a smaller median because I expect it should use shorter words. The times median was 4.2 the Daily Mirror’s was 3.5. The Journal’s was 3.6. The shows me that the times generally has a higher set of values but also that 50% of the data is below 4.2 suggesting that the Times is the most difficult to read as it has the highest mean. The Daily Mirror has the lowest median of 3.5 suggesting that 50% of the data is below 3.5 which would indicate that the Daily Mirror generally uses smaller words. The IQR is found by taking away the UQ from the LQ and is a measure of spread is not affected by extremes so it shows the densest part of the data the middle 50%. The times had an IQR of 4.2, The Daily Mirror had an IQR of 3.7 and The Daily Mirror had an IQR of 3.6 this shows me that the times has the biggest range between the most densest part of the distribution and the Daily Mirror has the lowest. As it is not affected by extremes it’s a very accurate measure of spread and therefore a strong indicator of the fact the Daily Mirror and The Journal use shorter word length. The average word per letter in the Times is 5.27, The Journal 4.55 and The Daily Mirror 4.59. This suggests that the The Times generally uses bigger words than the Daily Mirror and The Journal in politics. What surprised me is the fact that the Daily Mirror’s average word length was greater than the Journal’s. This could be because of the Journal might concentrate more on sport.
I only did the word length of the political strand because of time constraints if I was to further the investigation more I would go deeper into politics and do a deep analysis on politics and a deep analysis on general news. I would also use a much broader range of newspapers from local newspapers from around the country to see if the news supports what the level of intelligence is seen by in that particular area.
I expected the data to be a lot more pronounced in the political word count to show a bigger difference between newspapers this was correct as the Times did seem to use a lot more sophisticated words. But the comparison between the Daily Mirror and The Journal was unexpected but the journal concentrates on sport rather than politics.