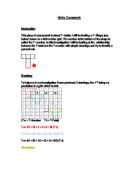
My prediction is already included on the 9x9 grid it is the Green T-shape.
Testing my prediction
My prediction was correct as you can see on the grid the green T-shape =337.
T-n= 81 + 72 + 62 + 63 + 64 = 337 (T-t)
General Rule
The general rule for finding the Nth term for the T-total is,
T-total = n + n – 9 + n – 19 + n – 18 + n – 17 = 5 n - 63
Using the nth term 5n – 63 I should be able to choose a T- number randomly (has to be n) and use this new rule to work
out the T-total.
Testing the general rule
I will now choose a random T-number on a 9x9 grid to test my rule.
T-n = 63 + 54 + 44 + 45 + 46 = 252 (T- t)
I will now test this with my rule: n = 63
Nth term = 5n – 63= (5 x 48) 315 – 63 =252
T-total = 252
Part 2
With the results from part 1 where I looked at the relationship between the t-total and the T-number. I will now take this investigation further by using different grid sizes. I am going to use grid sizes 7 x 7 and 8 x 8 to see if there is any difference in the relationship between the T-total and T-number.
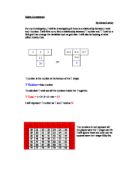
Drawings
I am going to draw the following grids 7x7 and 8x8. I produce 3 T-shapes on each grid the 4th
T - shape being my prediction.
T - n = 16 + 9 + 1 + 2 + 3 = 31(T-t)
T - n = 24 + 17 + 9 + 10 + 11 = 71(T-t)
T – n = 32 + 25 + 17 + 18 + 19 = 111 (T-t)
T – n = 18+ 10 + 1 + 2 + 3 = 34 (T- n)
T – n = 27 + 19 + + 10 + 11 + 12 = 79 (T- n)
T – n = 36 + 28 + 19 + 20 + 21 = 124 (T- n)
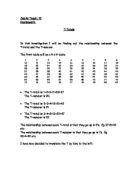
Table of Results
My results for the 7x7 and 8x8 grid will be put into a table, so that I can see if there are any patterns emerging.
7 x 7 Grid 8 x 8 Grid
General Rule
These are the nth terms for Grids 7x 7 and 8 x 8.
7 x 7 8 x 8
T-total = n + n – 7 + n – 15 + n – 14 + n – 13 T-total = n + n – 8 + n + 17+ n – 16 +n -15
=5n – 49 = 5n – 56
Identifying the pattern
There is a clear pattern on the 7 x 7 grid as the T- n goes up by 8 the T- t increases by 40 every time. On the 8 x 8 grid the T-n goes up by 9 every time and the T-t increases by 45.
I have also noticed that every time the grid size gets smaller the nth term decreases by 7 but the 5n does not change.
Prediction
I predict that the nth term for the 6 x 6 grid will be 5n – 42, I am basing this on the results from my other grids.
Testing prediction
I will now test my prediction:
t-n = 22 + 16 + 9 + 10 + 11 = 68 (T-t)
T- total = n + n – 6+ n – 13 + n – 12 + n – 11 = 5n - 42
Part 3
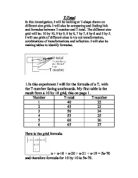
Introduction
I will now try to find an overall rule that will allow me to work out the T – total on any grid size. I am going to use the evidence that I have found from the three grid sizes 7 x 7, 8 x 8 and 9 x 9 to help investigate the relationship between the grid size and the T-total.
Overall Rule
I am going to use all the nth terms from the 3 grids and put them in a table and try to find a rule that will work on any grid size.
7 x 7 8 x 8 9 x 9
n = T - number
G = Grid size
General Rule
I will now solve the rule.
T-total=n + n–g + n–2g +1 + n–2g + n-2g – 1 = 5n – 7g
The rule to find any t – total in any grid size is 5n – 7g.
Testing overall rule
To prove that my rule does work I will test it on 6 x 6 and 10 x 10 grids
T- n = 32
5n – 7g =(5 x 32) 160 – (7 x 6) 42 = 118 (T-t)
T-t = 32 + 26 + 19 + 20 + 21 = 118
T-n = 19
5n – 7g = (5 x 19) 95 – (7 x 5) 35 = 60 ( T- t)
T – t = 19 + 14 + 8 + 9 + 10 = 60