Diagram 4: (all 4 lines cross each other, regions are depicted with numbers, crossover points are high-lighted with red circles)
In this diagram there are:
Diagram 5: (all 5 lines cross each other, regions are depicted with numbers, crossover points are high-lighted with red circles)
In this diagram there are:
Diagram 6: (all 6 lines cross each other, regions are depicted with numbers, crossover points are high-lighted with red circles)
In this diagram there are:
I will start this part of my investigation by looking for a recursive pattern (the way each term relates to the one before it) and use what I have learnt about sequences to create formulas to predict the results for a diagram with 7 (or ‘n’) lines.
Some definitions:
If (n) is the number of lines (where n can be any natural number) then
the number of Open Regions is given by: OR(n)
the number of Cross –Over Points is given by: COP(n)
the number of Closed Regions is given by: CR(n)
the number of Total Regions is given by: TR (n)
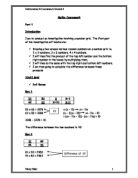
Step 1
To investigate the first pattern I will list the number of Open Regions: OR(n)
By inspection, OR(1) = 2
OR(2) = 4
OR(3) = 6
OR(4) = 8
OR(5) = 10
OR(6) = 12
This sequence can also be written as:
I found that the values in the ‘First Difference’ line are the same or ‘constant’ number + 2. The terms are even numbers or multiples of 2. For each new (non-parallel) line that is added, there will be two more Open Regions. I can summarise this rule for working out even numbers with a formula like this:
Thus, OR(n) = 2(n) by inspection
I can check my formula by using data I have already collected and know to be correct.
OR (2) using the formula 2(n) let n = 2
2(2) = 4 CORRECT!
OR (3) using the formula 2(n) let n = 3
2(3) = 6 CORRECT!
OR (5) using the formula 2(n) let n = 5
2(5) = 10 CORRECT!
To test the prediction I made I draw a diagram with 7 lines. Counting the open regions confirms the result of 14
This diagram, where lines (n) = 7 and every line crosses every other line, (no lines are parallel) proves that the formula I used to predict the amount of Open Regions
2(n) is correct because there are 14 Open Regions in this diagram, and that is what I predicted.
Step 2:
I will list the number of cross-over points to investigate the pattern in the second sequence.
The number of Cross –Over Points is given by: COP(n)
(n) is the number of lines (where n can be any natural number) then
By inspection, COP(1) = 0
COP(2) = 1
COP(3) = 3
COP(4) = 6
COP(5) = 10
COP(6) = 15
This sequence can be written as:
Since the values of the first difference are not the same, I find the second difference. I found that the values in the ‘Second Difference’ line are the same or ‘constant’. From what I have learnt in class, I know that the polynomial for this sequence of values is quadratic (an expression is quadratic if the highest power of the variable is 2). It is of the form
Investigation (i)
To solve for the sequence I will find (b) where:
(n) can be defined as the number of lines or terms
(a) can be defined as ½ the second difference
(c) can be defined as the zero term where the n term is equal to ‘0’
let n = 1
a = ½
c = -1
(½) x (1)2 + b x (1) – 1 = 0
½ + b - 1 = 0
b = ½
Substitute (b) as found above into the formula to check its accuracy for the first term in the sequence COP(1).
b = ½
n = 1
a = ½
c = -1
(½) x (1)2 + (½) x (1) – 1 = COP(1)
(½) + (½) –1 = COP(1)
0 = COP(1) – which is correct
Investigation (ii)
To solve for the sequence I will find (b) where:
(n) is the number of lines or terms
(a)is ½ the second difference
(c)is the zero term where the n term is equal to ‘0’
let n = 2
a = ½
c = -1
(½) x (2)2 + b x (2) – 1 = 0
(½) x (4) + b x (2) - 1 = 0
2b = -1
b = -½
Substitute (b) into the formula to check its accuracy for the second term in the sequence COP(2).
(½) x (2)2 + (-½) x (2) – 1 = COP(2)
(½) x (4) + (-½) x (2) –1 = COP(2)
2 + (-1) -1 = COP(2)
0 = COP(2) – which is not correct
It would seem that the formula: an2 + bn + c = 0 does not work for the sequence COP(n). However I have noticed another possibility if I were to rearrange the formula using the values for (a), (b) and (c) that I found in Investigation (i)
As before let:
b = ½ (as found in Investigation (i))
a = ½ (can be defined as ½ the second difference)
c = -1 (can be defined as the zero term where the n term is equal to ‘0’)
COP (n) = ½ n2 + ½ n –1
= n2 + n - 1
= ½n (n+1) – 1
= n(n+1)/2 – 1
COP (2) is the second term of the sequence let n = 2
COP (2) = 2 (2 +2)/2 – 1
=8/2 – 1
= 4 – 1
= 3
COP (2) is not 3. Therefore this formula does not work.
Investigation (iii)
I will investigate a new formula for the sequence of numbers.
If I start the sequence with 1. Add 2 to get 3. Add 3 to get 6. Add 4 to get 10. Continue the pattern to get: 1, 3, 6, 10, 15, 21, 28, 36, 45, …
I notice that these numbers are triangular numbers.
The terms of this sequence or ‘triangular numbers’ increase in a way that can be represented by triangular patterns of dots like this:
COP(2) COP(3) COP(4) COP(5) COP(6)
1 3 6 10 15
The formula for producing them is: n(n + 1)/2
I will apply this formula to the sequence COP (n)
[where (n) is the number of lines in the diagram]
COP(2) let n = 2
2 (2+1)
= 2
= 6
2
= 3
COP (3) let n = 3
3 (3+1)
= 2
= 12
2
= 6
I can check that the formula is true for triangular numbers by looking at the dot pattern diagrams above.
But the sequence for Cross-over Points is:
COP(1) = 0
COP(2) = 1
COP(3) = 3
COP(4) = 6
COP(5) = 10
COP(6) = 15
COP (2) is not equal to 3 and COP (3) is not equal to 6. Therefore this formula does not work.
Investigation (iiii)
The same problem keeps emerging for all the formulas for Cross-over Points I have tried so far. However I can see that the sequence for COP (n) and Triangular numbers are very similar. The only difference is this:
The first term of the sequence COP (1) is: 0.
The first term of a sequence of triangular numbers is: 1.
When I looked at Diagrams 1- 6 again it became clear that when no lines are parallel, each new line intersected exactly once with each previous line. Thus, when the nth line is added, it makes (n-1) new intersections or cross-over points.
I decided to incorporate this concept into the formula I have for discovering the nth term in a sequence of triangular numbers. So instead of
n (n+1) n (n-1)
2 I’ll try 2 [where (n) is the number of lines in the diagram]
To test this formula I will substitute some known terms into the equation.
COP(2) let n = 2
2 (2-1)
= 2
= 2
2
= 1 CORRECT!
COP (3) let n = 3
3 (3-1)
= 2
= 6
2
= 3 CORRECT!
COP (6) let n = 6
6 (6-1)
= 2
= 30
2
= 15 CORRECT!
To test the prediction I made, I draw a diagram with 7 lines.
This diagram, where lines (n) = 7 and every line crosses every other line, (no lines are parallel) proves that the formula I used to predict the amount of cross-over points in the sequence COP (7) is correct because there are 21 cross-over points in this diagram, and that is what I predicted.
Step 3:
I will list the number of Closed Regions to investigate the pattern in the third sequence.
The number of Closed Regions is given by: CR(n)
(n) is the number of lines in the diagram (where n can be any natural number) then
By inspection, CR(1) = 0
CR(2) = 0
CR(3) = 1
CR(4) = 3
CR(5) = 6
CR(6) = 10
This sequence can be written as:
It seems to me that this series is identical to the sequence COP(n), except that the start point is moved back by one step.
Thus, if COP(n), = n (n-1)
2
when I looked at Diagrams 1- 6 it becomes obvious that when no lines are parallel, each new line intersected exactly once with each previous line. Thus, when the nth line is added, it makes (n-1) new intersections or cross-over points and (n-2) closed regions.
I can show that moving the start point will affect the formula in the following way:
CR(n) = (n-1) (n-2)
2, for the real positive integers above 1.
I can expand the polynomial so that it becomes:
CR(n) = (n2 –3n + 2)
2
To test this formula I will substitute some known terms into the equation. I can use this sequence to check that the answers I get when using the formula are correct.
CR(1) = 0
CR(2) = 0
CR(3) = 1
CR(4) = 3
CR(5) = 6
CR(6) = 10
(i) CR(1) let n = 1
CR(1) = (12 – 3(1) + 2)
2
CR(1) = 1 – 3+ 2
2
CR(1)= 0 CORRECT!
(ii) CR(2) let n = 2
CR(2) = (22 – 3(2) + 2)
2
CR(2) = 2 – 6+ 2
2
CR(2)= 0 CORRECT!
(iii) CR(3) let n = 3
CR(3) = (32 – 3(3) + 2)
2
CR(3) = 9 – 9+ 2
2
CR(3)= 1 CORRECT!
(iv) CR(4) let n = 4
CR(4) = (42 – 3(4) + 2)
2
CR(4) = 16 – 12+ 2
2
CR(4) = 6
2
CR (4) = 3 CORRECT!
CR(6) let n = 6
CR(6) = (62 – 3(6) + 2)
2
CR(6) = 36 – 18+ 2
2
CR(6) = 20
2
CR (6) = 10 CORRECT!
To test the prediction I made, I draw a diagram with 7 lines.
This diagram, where lines = (n) = 7 and every line crosses every other line, (no lines are parallel) proves that the formula I used to predict the amount of closed regions in the sequence CR (7) is correct because there are 15 closed regions in this diagram, and that is what I predicted.
Step 4:
I will list the number of Total Regions to investigate the pattern in the fourth sequence.
The number of Closed Regions is given by: TR(n)
(n) is the number of lines in the diagram (where ‘n’ can be any natural number) then
By inspection, TR(1) = 2
TR(2) = 4
TR(3) = 7
TR(4) = 11
TR(5) = 16
TR(6) = 22
From looking at the information I gathered when looking at Diagram 6 I noticed the following:
Open Regions + Closed Regions = Total Regions
Based on this observation, I will investigate the following theory:
Adding the two formulas I have found for OR(n) (Open Regions) and CR (n) (Closed Regions) together, should create an accurate formula to define the sequence TR(n)
OR (n) is defined by the formula: 2(n)
CR (n) is defined by the formula: (n2 –3n + 2)
2
Let TR(n) = 2(n) + (n2 –3n + 2)
2
To test this formula I will substitute some known terms into the equation. I can use the known sequence for TR (n) to check that the answers I get when using the formula are correct.
(i)TR(1) let n = 1
TR(1) = 2(1) + (12 –3(1) + 2)
2
TR(1) = 2 + (1-3 +2)
2
TR(1) = 2 CORRECT!
(ii)TR(2) let n = 2
TR(2) = 2(2) + (22 –3(2) + 2)
2
TR(2) = 4 + (4-6 +2)
2
TR(2) = 4 CORRECT!
(iii)TR(3) let n = 3
TR(3) = 2(3) + (32 –3(3) + 2)
2
TR(3) = 6 + (9-9 +2)
2
TR(3) = 7 CORRECT!
(iv)TR(6) let n = 6
TR(6) = 2(6) + (62 –3(6) + 2)
2
TR(6) = 12 + (36-18 +2)
2
TR(6) = 22 CORRECT!
To test the prediction I made, I draw a diagram with 7 lines.
This diagram, where lines = (n) = 7 and every line crosses every other line, (no lines are parallel) proves that the formula I used to predict the amount of total regions in the sequence TR (7) is correct because there are 29 total regions in this diagram, and that is what I predicted.