The table on the previous page tells me what is involved in the nth term. The column labelled ‘1st Difference’ tells us the difference between the number of bad tomatoes in the first hour to the second hour and so on. The column labelled ‘2nd Difference’ is the difference between the figures in the ‘1st Difference’ column. When the differences become the same this is when I can stop. If there was a ‘2nd Difference’ column then that means there will be a 2 involved in the nth term.
In total there are only 3 starting positions. They are one in the corner, one next to it on the side and one of the four squares in the middle. The tray above in a 4 x4 and in total it took 5 hours for all the tomatoes in the tray to go bad. The table just above this paragraph shows the total number of bad tomatoes. The columns towards the right hand side determine what the nth term will involve. If there are two differences that means the nth term will involve a 2.
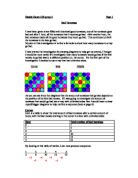
Now I am going to look at the same size tray with the bad tomato starting in another position. We can see now long it will take all the tomatoes in the tray to go bad.
As it is possible to see from the table above there are two differences, which means that the nth term will involve 2.
Now that I have found out that there is a 2 involved in the formula. I will now draw out a table in which I will find out the formula through trial and error. To begin with I will double the number and then 2 it. When I begin to see that there is something there I will 2 it and then double to try to get to the right number.
The nth term is:
Part 2
Now I am looking at different sizes of trays and different positions in the tray. The first size I am going to look at is: 10 x 10 and the bad tomato will be positioned in the corner.
Now I am going to find out how many differences are involved.
Now I know that there is a 2 involved in the formula as there are 2 differences. So I will now place the numbers in table to find out the formula. To begin with I will double the number and then 2 it. If that does not work I will try to use different ways such as 2ing and then misusing the n number.
As it can be seen I found the formula in four steps and these steps I may use in other trays further in this project.
The nth term is:
n²+n
2
So by putting the numbers we know in the formula (hours) we can find out how many tomatoes go bad in particular number of hours in a 10x10 tray with the bad tomato starting in a corner.
Now I am going to look at another position on a 10 x 10 tray. The position I am going to look as is starting from the middle.
Now like previously in this project I am going to find out how many differences are involved so I can work out the formula.
As you can see from the table above there are two differences which means there is a 2 involved in the formula. The table on the next page will show my working outing out and how I got the formula.
The nth term is:
2(n²-n)+1
Now I am going to use the same size tray, which is 10 x 10, and place the bad tomato on the side.
Now like previously in this project I am going to find out how many differences are involved.
As it is possible to view, there are also two difference here just like the others we have seen so far. It is also possible to see from the table above that the formula is not going to be very complicated.
The nth term is:
n²
Conclusion:
I have looked at different ways by which the bad tomatoes can spread. All of the nth terms above are not for a particular size tray. Even though I said I used a 10 x 10 tray that was only to start off with. In fact all the formulas above are really for large trays.
I believe the main reason behind this investigation is to find out the a formula that by just knowing the size of the tray and exact position in the tray of the bad tomato will tell how long it will take for all the tomatoes to go bad.
Before I write down the formula I will tell you how I arrived at it. The formula will tell you how long it will take to make all the tomatoes in the tray go bad. Firstly the formula should involved the size of the tray e.g. 6 x 8 and also must involved the starting position of the first bad tomato. Now that I have explained what have got to be in the formula, well, here it is.
(a-x) + (b-y)
‘a’ and ‘b’ stand for the width and depth of the tray. ‘x’ and ‘y’ stand for the positioning of the first bad tomato. So, for example if we take a 8 x 6 tray with starting bad tomato at the position (4,4) the working to find how long it will take for the whole tray to go bad should look like:
(a-x) + (b-y)
(8-4) + (6-4)
Answer: 6 hours