Boys
GIRLS
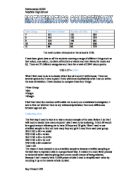
Mean, Mode, Median, Range
Boys (Mean)
Height = 1.8+1.62+1.61+1.65+1.8+1.81+1.68+1.67+1.97+1.84+1.57+1.73
= 20.75
20.75 / 12 =1.7291
Mean = 1.723
Weight = 60+56+47+54+72+54+63+70+84+78+54+50
= 742
742 / 12 = 61.8333
Mean = 61.83
(Mode)
Boy’s height: - 1.6
Boys Weight: - 54
(Median)
Height
1.57,1.61,1.62,1.65,1.65,1.67,1.68,1.73,1.8,1.8,1.8,1.84,1.97
1.67+1.68 = 3.35 / 2= 1.675
Median = 1.68
Weight
47,50,54,,54,54,56,60,63,70,72,78,54
56+60=116
116/2=58
(Range)
Height
1.97-1.57=0.4
Weight
84-47=37
Girls
(Mean)
Height: - 1.6+1.62+1.68+1.62+1.65+1.55+1.68+1.56+1.58+1.56+1.7+1.65= 19.45
19.45/12=1.6208
Mean =1.62
Weight: - 54+54+47+51+54+50+50+45+48+38+54+48 =593
593/12= 49.416662
Mean = 49.4
(Mode)
Height:-1.6
Weight: - 54
(Median)
Height:- 1.55,1.56,1.56,1.58,1.6,1.62,1.62,1.65,1.65,1.68,1.68,1.7
1.62+1.62 = 3.24
3.24 / 2 = 1.62
Median = 1.62
Weight : - 38,45,47,48,48,50,50,51,54,54,54,54
50+50 = 100
100 / 2 = 50
Median = 50
Range
Height: - 1.7-1.55= 0.15
Range = 0.15
Weight: - 54-38 = 16
Range = 16
Here is a summary table of mean, mode, median and range.
Here is a cumulative frequency diagram.
Averages
Extending the investigation
Hypothesis: - The taller you get the heavier you get.
Here is a stem and leaf diagram in order to make grouped data into the class intervals.
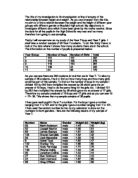
Sample of Equations
Page... (Boys height scatter diagram)
Y=0.58x+135
Example:-
- Choose Weight (figure) between 0-110 kg
- Multiply that number by 0.58
E.g.
60 x 0.58 = 34.8
Number or weight (kg) chosen at random
- Add 135
- Answer = 169.8 (height)
Page… (Girls height and weight scatter diagram)
Y = 0.7x+129
Example:-
- Choose Weight (number/figure) between 0-110 (weight)
- Multiply that number by 0.7
E.g.
60 x0.7= 42
Number or weight (Kg) chosen in random
Page... (Boys and girls scatter diagram of height and weight)
Y= 0.571x 134
Example:-
- Choose Weight (number/figure) between 0-110 (weight)
- Multiply that number by 0.571
E.g.:-
60x0.571=34.26
Number or weight (kg) chosen at random
Summary
Referring to the graph of boy’s weight most of the boys weigh between 46-60kg.
In comparison to the girls most of the girls weigh between 45-55 kg.
This shows that the girls weigh less than the boys. In terms of height the boys are more evenly distributed with majority of the boy’s being 151 metres and 1.85 metres.
The girls on the other hand have their weight concentrated between 1.56 metres and 1.70 metres. The girls are shorter and heavier but the boys are taller and weigh more.
The line graph on page … (boy’s and girls weight) shows a shorter distribution of weight for the girl’s but in comparison with the girl’s the boy’s have a wider distribution of weight. The same applies for the height for boys and girls.
An analysis of boys and girls, weight and height were made using mean, mode, median and range. The results are as follows;- in accordance to page … ( summary of mean, mode and range). The summary shows the boys in average have a higher mean in height as well as weight in contrast to the girls in correspondence in summary analysis for height and weight for boys and girls for the same figures appear which were 1.6metres and 54kg.
The medium value’s show’s that the boys have higher figures than the girl’s. The boys have a higher range in height and weight, the biggest difference coming in the weight values. This concretes the fact that boys are taller than the girls and have a wider distribution.
I have drawn a histogram and frequency polygon diagram in order to compare two continuous variables are best compared in terms of histogram and frequency polygons.
The stem of 160 has a lot of leaves compared to other stem for boys and girls. The boy’s stem of 180 has four leaves so has the girls stem 150. This is documented by the graphs. The modal class is the same for both boys and girls which is 150 – 160 cm.
Referring to the hypothesis: - “The taller you get the heavier you get” the three scatter diagrams show correlation between weight and height. In the individual scatter diagram for boys and girls separately there is a weaker correlation. In the mixed scatter diagram there is a stronger correlation.
From these scatter diagrams the equations of lines were produced. This enables me to estimates the values of boys and girls height and weight.
There were fewer students in Year 11 then any others years.
This makes the bias or unfair because I was choosing from a smaller sample.
Final Summary
A sample of 50 year 11 students from Mayfield High School was chosen for this investigation. I chose every other boy and girl; these bought my sample down to 12 boys and 12 girls. This data was analysis for a relationship for height and weight.
The relationship I found after analysing this set of data was that boys were heavier and taller in comparison to girls. The girls in general are less weight and shorter.