Scott Brimble
Graphs for Hypothesis One
Results
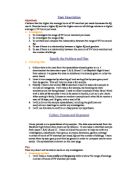
My graphs show that my prediction was wrong, and there is no correlation between the weight and hours of T.V. Watched per Week in year 8.
IS THE PREDICTION TRUE: NO
Scott Brimble
Hypothesis Two
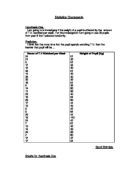
I am going to investigate if the height of a pupil has any affect on their weight. For this investigation I am going to use 30 pupils from year 7.
Prediction
I think that the heavier the pupil then the taller they will be.
Scott Brimble
Graphs for Hypothesis Two
Result
My graphs show that there is correlation except for one result, so my prediction was right, the bar chart shows that the wave of the weight is almost parallel to the waves of the height, so that shows the correlation clearer.
IS THE PREDICTION TRUE: YES
Scott Brimble
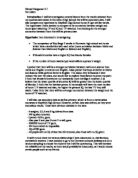
Hypothesis Three
I am going to investigate if a pupil prefers Art and Design to PE, will their IQ be higher. For this investigation I am going to use 20 pupils that I picked randomly from year 8, 10 who prefer PE and 10 that prefer Art and Design.
Prediction
I think that the pupils that prefer Art and Design will have a higher IQ than the pupils that prefer PE.
Averages
PE: 104
Art and Design: 108
What this shows:
This shows that art and design have the highest IQ in total although having the least, art and design have the biggest range IQ’s and PE have roughly all the same IQ except for one pupil.
Scott Brimble
Graphs for Hypothesis Three
Result
My graphs doesn’t back up my prediction that art and design student have a higher IQ because almost every PE pupil on the bar chart is a about the same IQ than those of art and design and you can see that on the scatter diagram that the art and design students have more range with their IQ’s so that is why they have a higher average.