Statistics Coursework
Aim:
To investigate if there is a relationship between the length and width of the leaves. I will also investigate summary measures to represent my data.
Data Collection:
I choose to collect my leaves from a tree in my back garden, as it was easy to access. I picked the leaves from different places and different heights around the tree so that my sample of leaves would be random. I choose a sample size of 35 leaves because it is large enough to reflect the trend amongst the width and length of the leaves on the tree, but still keeping it to a manageable size. When I collected 35 leaves I measured the length of each leaf in millimetres from the end of the stalk where it is attacked to the tree to the tip. I measured the widest part also in millimetres to find out the width.
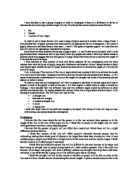
The results are in the table below: -
Length mm
Width mm
Length mm
Width mm
30
60
10
50
90
40
96
44
00
50
05
50
70
30
70
34
67
33
80
43
95
45
10
40
97
47
11
55
23
60
19
62
15
58
81
43
36
64
20
63
20
57
10
50
93
47
03
46
12
58
93
40
83
41
92
44
77
36
85
45
89
39
30
78
25
61
28
71
57
25
Analysis of Data:
First I shall calculate a summary value from the raw data. A measure of location is the mean. It is used when all the actual values are taken into account. In this circumstance that is true, therefore I am using the mean. I measure of dispersion is standard deviation.
The formula for the mean is:
Mean= Total of all values
Number of values
x=?x
n
I added all the lengths and called the x. I added all the widths and called them y.
x=3522/35
x=100.63mm
y=1709/35
y=48.83mm
The formula for standard Deviation is:
Measurement
Total
Mean
Standard Deviation
LENGTH
3522
Aim:
To investigate if there is a relationship between the length and width of the leaves. I will also investigate summary measures to represent my data.
Data Collection:
I choose to collect my leaves from a tree in my back garden, as it was easy to access. I picked the leaves from different places and different heights around the tree so that my sample of leaves would be random. I choose a sample size of 35 leaves because it is large enough to reflect the trend amongst the width and length of the leaves on the tree, but still keeping it to a manageable size. When I collected 35 leaves I measured the length of each leaf in millimetres from the end of the stalk where it is attacked to the tree to the tip. I measured the widest part also in millimetres to find out the width.
The results are in the table below: -
Length mm
Width mm
Length mm
Width mm
30
60
10
50
90
40
96
44
00
50
05
50
70
30
70
34
67
33
80
43
95
45
10
40
97
47
11
55
23
60
19
62
15
58
81
43
36
64
20
63
20
57
10
50
93
47
03
46
12
58
93
40
83
41
92
44
77
36
85
45
89
39
30
78
25
61
28
71
57
25
Analysis of Data:
First I shall calculate a summary value from the raw data. A measure of location is the mean. It is used when all the actual values are taken into account. In this circumstance that is true, therefore I am using the mean. I measure of dispersion is standard deviation.
The formula for the mean is:
Mean= Total of all values
Number of values
x=?x
n
I added all the lengths and called the x. I added all the widths and called them y.
x=3522/35
x=100.63mm
y=1709/35
y=48.83mm
The formula for standard Deviation is:
Measurement
Total
Mean
Standard Deviation
LENGTH
3522