Hypothesis
Here in this statistical piece of course work we are given a spreadsheet with loads of information about students in Mayfield High. This spreadsheet was provided to us by the school. Below are the headings that are available on the spreadsheet.
* Name
* Age
* School year
* Hair colour
* Eye colour
* Favorite colour
* Favorite sport
* Favorite Subject
* Favorite TV program
* Number of TV hours per week
* IQ
* Height & Weight
* Distance from school
* Means of transport to school
* No. of siblings
* No. of pets
* KS2 results (English, math, Science)
Specify the Problem and Plan
For my statistics assignment I am going to investigate the hypothesis that the in KS3 the higher your IQ is, the higher your average Key Stage results is. So if a student has a high IQ he'd have a high key stage results but if he has a low IQ he'd have a low Key Stage results. And that Female's have a higher IQ and do better than males in their KS3 results. I think this is true because IQ is a representation of the human smartness and that would affect greatly the average results.
* Student ID (I have created that for later sampling use)
* Year Group
* Gender
* IQ
* KS3 Math's results
* KS3 Science Results
* KS3 English Results
* Average KS3 Result
I will get this information from a spreadsheet given to us. I will use all the years 10 & 11. I have chosen these sources above because they relate fully to what I'm planning to investigate.
In years 10 and 11 there are 370 students
For this investigation I will use a sample size of 50 students. I will divide this number by years 10 and 11 and by males and females using Stratified sampling. In this sample, every value should have an equal chance of being selected. I should make sure there is no bias. The way to do this is to get a list of all pupils details that I need Years 10 & 11) and give them an I.D number them from to 370, then I would get Ms Excel to give out a random number between 1 till 370 for each of the 50 pupils in my sample, then I would convert number to names corresponding to each individuals I.D number.
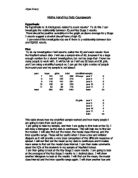
Collect, Process and Represent
In the collection process I have to collect 50 x 7 pieces of information. The fifth piece of information (which is the I.D) would be only for sampling use and would not affect my investigation. Firstly I would have to work out the number of pupils recorded on to this spreadsheet that would affect me.
Year Group
Number of Males
Number of Females
Total
0
06
94
200
1
84
86
70
TOTAL =
90
80
370
Now I'm going to use stratified sampling so that I would have proportional results.
Males = (190*100) = 51% = 26 results
370
Females = (180*100) = 49% = 24 results
370
Year 10 Males = (106*100) = 56% = 15 results
190
Year 11 Males = (84*100) = 44% = 11 results
Here in this statistical piece of course work we are given a spreadsheet with loads of information about students in Mayfield High. This spreadsheet was provided to us by the school. Below are the headings that are available on the spreadsheet.
* Name
* Age
* School year
* Hair colour
* Eye colour
* Favorite colour
* Favorite sport
* Favorite Subject
* Favorite TV program
* Number of TV hours per week
* IQ
* Height & Weight
* Distance from school
* Means of transport to school
* No. of siblings
* No. of pets
* KS2 results (English, math, Science)
Specify the Problem and Plan
For my statistics assignment I am going to investigate the hypothesis that the in KS3 the higher your IQ is, the higher your average Key Stage results is. So if a student has a high IQ he'd have a high key stage results but if he has a low IQ he'd have a low Key Stage results. And that Female's have a higher IQ and do better than males in their KS3 results. I think this is true because IQ is a representation of the human smartness and that would affect greatly the average results.
* Student ID (I have created that for later sampling use)
* Year Group
* Gender
* IQ
* KS3 Math's results
* KS3 Science Results
* KS3 English Results
* Average KS3 Result
I will get this information from a spreadsheet given to us. I will use all the years 10 & 11. I have chosen these sources above because they relate fully to what I'm planning to investigate.
In years 10 and 11 there are 370 students
For this investigation I will use a sample size of 50 students. I will divide this number by years 10 and 11 and by males and females using Stratified sampling. In this sample, every value should have an equal chance of being selected. I should make sure there is no bias. The way to do this is to get a list of all pupils details that I need Years 10 & 11) and give them an I.D number them from to 370, then I would get Ms Excel to give out a random number between 1 till 370 for each of the 50 pupils in my sample, then I would convert number to names corresponding to each individuals I.D number.
Collect, Process and Represent
In the collection process I have to collect 50 x 7 pieces of information. The fifth piece of information (which is the I.D) would be only for sampling use and would not affect my investigation. Firstly I would have to work out the number of pupils recorded on to this spreadsheet that would affect me.
Year Group
Number of Males
Number of Females
Total
0
06
94
200
1
84
86
70
TOTAL =
90
80
370
Now I'm going to use stratified sampling so that I would have proportional results.
Males = (190*100) = 51% = 26 results
370
Females = (180*100) = 49% = 24 results
370
Year 10 Males = (106*100) = 56% = 15 results
190
Year 11 Males = (84*100) = 44% = 11 results