Constants
I must keep things constant to ensure that I have planned and then carried out a fair experiment.
Experiment A
- The position of the weight must be in the same position. If it weren’t it would mean that the moments on each side would be different. This could affect my results adversely.
- The distance from the end of the piece of wood. This is because I am only investigating this experiment with varying weight. (100mm)
- The length of the bridge (900mm)
Experiment B
- The position of the weight must be in the same position. If it weren’t it would mean that the moments on each side would be different. This could affect my results adversely.
- The weight had to remain the same as I am only investigating the affect of varying distance from centre. This is 50g.
- The length of the bridge (900mm)
Variables
In order to carry out an investigation there are factors which I have to vary in order to obtain a result.
Experiment A
- The mass, as this is the factor I am investigating in this experiment.
Experiment B
- The distance from the end of the piece of wood, as this is the factor I am investigating in this experiment.
Experiment A
Aim
- To investigate the affect of varying the weight on the extension
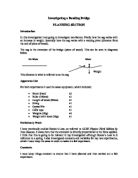
Diagram
Plan
- Set up diagram as shown above
-
Recorded the original height (ho)
- Started with 50g then recorded the height
- Recorded the original height again
- Added on an extra 50g grams, giving a total of 100g
- Repeated this process but with 150g, 200g having done 50g and 100g
I repeated all the results four times to minimise the source of random error.
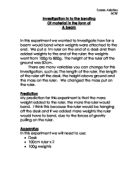
Hypothesis
I think that when the extension will be directly proportional to the increase in weight. This is in accordance with Hooke’s Law that the extension is directly proportional to the force applied. Hooke’s Law is for springs, however I think that the bending bridge will show the same relationship as springs to. The equivalent of the elastic limit in the bridge will be when it breaks.
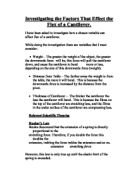
In these diagrams I am showing how when a force (weight) is applied the extension also increases.
50g 100g
Weight Weight
The molecules are applied to a force twice as great, which means that they will extend by twice as much.
Experiment B
Aim
- To investigate the affect of varying the distance from the centre of the bridge
Diagram
Plan
- Set up diagram as shown above
-
Recorded the original height (ho)
- Started with the retort stands 400mm away from the centre
- Used a mass of 50g and recorded the height
- Repeated this with the distance from centre as 300mm, 200mm and 100mm
I repeated all the results four times to minimise the source of random error.
Hypothesis
I think that the further away the retort stands are from the centre the greater the extension. This is due to the moments. A moment is found by multiplying the force applied by the perpendicular distance from the fulcrum (pivot). The fulcrum is the clamp on the retort stand. Therefore the greater the distance from the centre the greater force there is. Referring back to Hooke’s Law the greater force applied the greater extension.
OBTAINING EVIDENCE SECTION
Results
I have carried out my experiment successfully and put the results into a table below. All the results are to significant figures. The first three columns are to 3sf, and the last column is to 2sf. This means that none of my calculations are more accurate than that the results I obtained.
Experiment A
Experiment B
ANAYLISIS SECTION
Using my results
From the results, which I have obtained I am now able to put in to graphs. This mean I will be able to compare my results, and see the relationships if any that they show.
What my results show
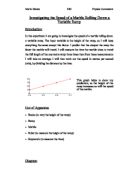
Experiment A
For this graph I have drawn a line of best fit. All the results are on this line or very close to. This firstly tells me that the results are directly proportional. As the weight (force applied is doubled) the sag is also doubled.
In my hypothesis I stated that the extension (sag) would be directly proportional to the force applied. This is what I found to be the case.
Experiment B
Having drawn this the graph
EVALUATING EVIDENCE SECTION
Quality of my evidence
I think that my results are of a high quality, in both experiments.
Sources of error
Possible ways to minimise errors
Further Work