Scatter graphs comparing boys and girls height to weight ratio
2
From these scatter graphs I have gathered that the boys in my primary data sample, are generally taller. Although the weight range for girls seems to be a lot smaller than the boys, the average weight for the girls is higher.
3
Frequency polygon for boy’s and girl’s heights
From this chart we can see the mode height for both boys and girls is between 1.51 metres and 1.60 metres. The range of heights is wider for the boys than the girls.
Frequency polygon for boy’s and girl’s weights
4
Like the height frequency graph, the mode for both boys and girls is the same. The mode weight is between 41kg and 50kg. Additionally, once again the range of weights is wider for the boys than it is for the girls. To differentiate between the heights to weight ratios properly we have to take into account the year groups.
Extension
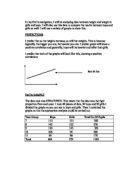
There are more upper-year females than there are upper-year males and more lower-year males than there are lower-year females. This can make the results inaccurate because height and weight can change quite rapidly through years 7 to 11 which can, ultimately, effect averages and can give the wrong result.
I have put the year groups in descending order to show the inequality:
The following graph shows the inequality more clearly:
6
Even out the stats
To even out the statistics I will add the difference from the secondary data sample using random selection for each year to make it a fair analysis.
(Female results on page 8)
7
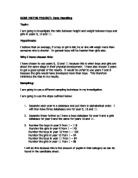
Extended hypothesis
I think that boys and girls are generally the same height and weight at the beginning of school but as the years progress the boys will get taller and heavier faster towards the end of school.
8
Plotting Graphs for the lower-year and upper-yeah students
Now I have even amounts of students for each yeah I have divided the year groups into lower-years and upper-years (7 and 8 are lower, 10 and 11 are upper).
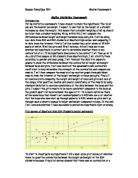
Lower-year analysis
From this scatter we can see that the females are generally taller and heavier than the boys in the lower-years.
From this frequency graph, it is evident that in the lower-years, females tend to be taller than males.
9
Here, the graph shows that girls in the lower-years are heavier than the boys
Lower-year height to weight ratio analysis
The graphs that I have presented of the lower-years height to weight ratio between boys and girls show that girls tend to be both taller and heavier than the boys. This is shown in the way the modes for each factor are higher for the girls, and this is visible in the graph where the line representing the girls statistics lean to the right in both graphs.
(Upper-year analysis on page 11)
10
Upper-year analysis
Comparing this graph with the lower-year scatter graph, the lower-year graph appeared to show the boys and girls to have approximately the same average height but the girls seemed to be heavier. There has been quite a change in the graph for the upper years from the lower-years; the boys seem to average heavier and taller than the girls.
Comparing this graph with the lower-year height frequency graph; the shape of the lines for the boys and the girls has swapped shapes, making the boys mode height higher than the girls. The frequency of a common height in the girls has reduced.
11
There has been quite a significant change from the lower-year weight frequency graph. On the lower-year graph the mode weight was equal yet the polygon was swaying to the right indicating the girls to be heavier; in this graph the girl’s mode weight has retracted making boys obviously heavier.
Conclusion
Summary:
I was first inquiring into the general height to weight ratio between the girls and boys that I was presented with, but the results I got in my scatter graphs were too close for me to come to any sharp conclusion. So I extended my project to look at the height to weight ratio between the boys and girls in the lower half of the school and the boys and girls in the upper half of the school.
Hypothesis:
I found that at in the early years of school the girls are both taller and heavier than boys, which did, in fact, disprove my hypothesis that boys and girls are the same height and weight during the early years of secondary school as an element of the extended hypothesis. Towards the later years in secondary school, boys were both taller and heavier.
Revised hypothesis:
In the earlier years of secondary school girls tend to be taller and heavier than boys, but as the years progress the boys grow taller and heavier than the girls.
By Laurence Osborne