Evidence from the sample suggests that 6 out of 30, or 20% of boys weigh in the range of 55-60 kg and that 11 out of 30, or 37% of girls weigh in the range of 45-50 kg
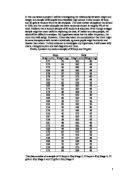
Height
Boys (Yr 7-11)
Girls (Yr 7-11)
Now I will draw histograms to present my data more clearly:
If we compare the 2 bar charts, we can clearly see thatthe spread for girls is much greater than the spread for boys. The girls also have the highest frequency in a single group, 15, while boys’ highest frequency is 11.
This graph is a dual bar chart. It allows me to compare the 2 sets of data- weight for boys and weight for girls.
Next, I will do the stem and leaf diagrams to find out the median for the height.
Boys (Yr 7-11)
-ordered:
Girls (Yr 7-11)
-ordered:
Mean Height
Mean height for boys = 5051 /30 = 168.36
Mean height for girls = 4829 /30 = 160.96
Modal Height
Modal height Group for boys = 170- 179
Modal height Group for girls = 160- 169
Median Height
Median height for boys =
(30 +1) / 2 = 15.5 = (15th + 16th) / 2 = (170 + 170) /2 = 170
Median height for girls =
(30 + 1) / 2 = 15.5 = (15th + 16th) / 2 = (162 + 163) /2 = 162.5
Range for height
Height range for boys = 185 – 150 = 30 cm
Height range for girls = 183 – 103 = 80 cm
To summarize those results here I have created a table:
The three measures of average (mean, median and the mode) are greater for boys than girls. However, the spread for girls’ height is significantly greater than for boys because of a particular individual, which is 80cm, compared to the boys which is 30cm In general the height for boys is greater than the height for girls.
The evidence from the sample suggests that 11 out of 30, 37% of the boys’ heights are between 170-179 cm, whilst 15 out of 30 girls, 50% of the girls’ heights are between 160-169 cm.
To compare the data graphically, I have drawn a frequency polygon with 2 lines: 1 for boys and 1 for girls.
These conclusions are based on a sample of only 30 girls and 30 boys. I could extend the sample or repeat the whole exercise to confirm my results, and make them more informative.
To sum up and see whether there is relationship between height and weight, I have chosen a sample of 30 students from Key Stage 3 and from those results I have created a scatter diagram:
There is a positive correlation between height and weight. This tells us, as I predicted in my introduction, that the taller the person, the more they will weigh. This is a qualititive statement.
To support my hypothesis, I will use Spearman’s rank corellation
later on in this coursework to quantify this result.
Further Investigation
I reckon that the correllation between height and weight will be better if I consider boys and girls seperately.
I have created the scatter diagrams (the last 3 pages) and the evidence shows that there is a stronger correllation between shoe size and height if boys and girls are considered seperately.
I have drawn by hand the lines of best fit. Those lines predict that a girl who was 172cm tall would weigh 52 kg, whereas a boy of the same height would weigh 64 kg.
The above values have been read from the graph. To be more precise I can use the formula y= mx + c.
If y represents the height in cm, and x represent weight in kg, the equations of the lines of best fit for my data set are:
Boys only: y =mx + c
Using the triangle from the boys scatter diagram, the change in y = 10, the
change in x = 12. Gradient = change in y / change in x , therfore, 10/12 =
5/6.
y= x + c
To find c, I’m using the point (144,40) which lies on the best fit line. I am
substituting these values for x and y
40 = x 144 + c
40 = 120 + c
40 – 120 = c
c = -80
The formula is y = x - 80
Where x = height (cm)
Where y = weight (kg)
Girls only: y =mx + c
Using the triangle from the boys scatter diagram, the change in y = 8, the
change in x = 18. Gradient = change in y / change in x , therefore, 8/18 =
4/9.
y= x + c
To find c, I’m using the point (150,42) which lies on the best fit line. I am
substituting these values for x and y
52 = x 150 + c
52 = 66 + c
52 – 66 = c
c= -14
The formula is y = x - 14
Combined sample: y = mx + c
Using the triangle from the boys scatter diagram, the change in y = 18, the
change in x = 18. Gradient = change in y / change in x , therefore, 18/18 =
1.
y =1 x + c
To find c, I’m using the point (166,52) which lies on the best fit line. I am
substituting these values for x and y
52 = 1 x 166 + c
52 = 166 + c
52 - 166 = c
c = -114
The formula is y = x – 114
Where x = Height (cm)
Where y = Weight (kg)
The equations above are to make a prediction of weight when I know height, and vice versa. I can predict a boy’s weight who is 166cm tall using the formula
y = x - 80
y = x 166 – 80
y = 58
so the weight of the boy who is 166cm tall would be roughly 58kg to the nearest whole number.
The line of best fit is the best estimation of relationship between height and shoe size. There are exceptional values in my data, for example the girl who is 103cm tall and weighs 45 kg which fall outside the genereal trend. The line of best fit is a continous relationship between height and weight in this case, however both of them are rounded to the nearest whole numbers.
A good idea would be to draw a cumulative frequency graph, as it is going to help me compare different data sets. The table below shows the cumulative frequency for weight for boys, girls, and for the combined sample.
Next, I will create a table for height, and draw a graph just like I did with weight.
I can now estimate, thanks to the cumulative frequency graphs, how many boys in the school are between 160cm and 170cm tall.
14 – 5 = 9
9/30 = 0.3
This means that 30% of the boys in Mayfield high school will be between 160 and 170 cm tall. This also can tell us that the probability of choosing a boy at random from the sample who’s height is in the range between 160 and 170 cm tall is 0.3
The median that I have worked out is slightly different than the median that I have recorded from the graphs. I will use the median from the working out because it is more precise. The median height for boys is 170cm. If I draw a line going upwards from the x axis to the curve for girls’ height, then I will read off how many girls in the sample had less than 170cm. 24 out of 30 girls i.e. 80% of the girls are shorter than the median height for boys. This means that 6 girls out of 30 i.e. 20% of the girls are taller than the median height for boys. In general, boys are taller than girls but as this evidence shows, 20% of girls have a height greater than the median height of the boys.
I have analysed my data and I have made quite a lot of findings about my data. Firstly, in all circumstances (boys, girls and mixed) there is a positive corellation between height and weight. In general, the taller the person is, no matter if its a girl or a boy, the more they will weigh. If we look on the scatter diagrams we can notice that the points on the one for girls are more dispersed than for boys. This means that the corellation for boys is better than for girls. The points on the scatter diagrams for boys and girls are less dispersed than the points on the scatter graph for the mixed sample of boys and girls. This suggests that the correllation between height and weight is better when boys and girls are considered seperately. The overall relationship between height and weight is linear, however there are a couple of points that do not fit the trend. We can predict a person’s height or weight just by looking at a scatter diagram. The line of best fit will give a rough estimate or the equation of a line to give a more precise result, using y=mx +c formula. Taking a look at the cumulative frequency curves, it is clearly shown that boys are heavier than girls. The median height and weight are also higher than the median height and weight for boys. Analysing this data is limited for the reason that my data is limited, and I could only choose a random sample of 30 boys and 30 girls. In a few cases there have been odd results, for example a girl that is 103 cm tall. Individuals like that fall out of the trend.
Considering Age
The sample that I have chosen at the beginning of this coursework was partly stratified. However, this data was bias and unprecise. I have taken boys from year 7-11 into 1 group, and I done the same for girls. If I consider age then this will reduce bias, because height and weight are affected by age. Corellation is better when age is taken into consideration. This is why I will stratify my data so that I will reduce bias as much as possible. The table below shows the spread of pupils across each year.
To take a stratified sample, I must divide the total numer of boys and girls by the total number of pupils in the school and multiply it by 60 (number of pupils in the sample).
The values for boys add up to 30, however, the values for girls add up to 29. Both groups must add up to 30, so what I decided to do is to round up 1 of the numbers. For year 11, the value would’ve been 4, but I decided to round it up to 5.
By taking a stratified sample I am pretty sure that my sample is representative of the whole school. As far as possible, my sample is free from bias caused by gender or age.
As I did with the previous sample, I am now going to work out the mean, median, and the range for the stratified sample.
Mean
Mean height for boys = 4869/30 = 162.3
Mean height for girls = 4753/30 = 159.6
Mean weight for boys = 1626/30 = 54.2
Mean weight for girls = 1417/30 = 47.23
Median
Median height for boys =
(30 +1) /2 = 15.5 = (15th + 16th) / 2 = (160 +160) / 2 = 160
Median height for girls =
(30 +1) / 2 = 15.5 = (15th + 16th) / 2 = (161 +161) / 2 = 161
Median weight for boys =
(30 +1) /2 = 15.5 = (15th + 16th) / 2 = (53 +53) / 2= 53
Median weight for girls =
(30 +1) / 2 = 15.5 = (15th + 16th) / 2 = (46+ 47) / 2 = 46.5
Range
Height range for boys = 185 – 150 = 35 cm
Height range for girls = 180 – 120 = 60 cm
Weight range for boys = 85 – 38 = 47 kg
Weight range for girls = 60 – 35 = 25 kg
These results are summarised in the table below:
Although this data is representative of the whole school, the sample wasn’t big enough to make any meaningful statements about the data within each year group. What I have decided to do is I will take a 10% sample from years 7 and 11, because, from common sense, they vary the most. There are 151 boys in year 7, so a sample 10%, or 15 of them (rounded to the nearest whole number). There are 131 girls in year 7, so a sample 10%, or 13 of them (rounded to the nearest whole number).
There are less boys and girls in year 11, so I will have to measure how many students I will take into account to make further investigations. There are 84 boys in year 11, so a sample 10%, or 8 of them (rounded to the nearest whole number). There are 86 girls in year 11, so a sample 10%, or 9 of them (rounded to the nearest whole number). I believe this will be sufficient.
Boys
Year 7 = 151 / 10 = 15.1 ~ 15
Year 11 = 84 / 10 = 8.4 ~ 8
Girls
Year 7 = 131 / 10 = 13.1 ~ 13
Year 11 = 86/ 10 = 8.6 ~ 9
Mean
***Year 7***
Mean height for yr 7 boys = 2347/15 = 156.46 cm
Mean height for yr 7 girls = 1929/13 = 148 cm
Mean weight for yr 7 boys = 739/15 = 49.26 kg
Mean weight for yr 7 girls = 550 / 13 = 42.3 kg
***Year 11***
Mean height for yr 11 boys = 1413/ 8 = 177 cm
Mean height for yr 11 girls = 1416/9 = 157.33 cm
Mean weight for yr 11 boys = 520/8 = 65 kg
Mean weight for yr 11 girls = 468/8 = 58.5 kg
Median
***Year 7***
Median height for yr 7 boys =
(15 +1) /2 = 7.5 = (7th + 8th) / 2 = (153 +155) /2 = 154 cm
Median height for yr 7 girls =
(13 +1) /2 = 14th /2 = 7th = 150 cm
Median weight for yr 7 boys =
(15 +1) /2 = 7.5 = (7th + 8th) / 2 = (47 +47) /2 = 47 kg
Median weight for yr 7 girls =
(13 +1) /2 = 14th /2 = 7th = 40 kg
***Year 11***
Median height for yr 11 boys =
(8 +1) /2 = 4.5 = (4th + 5th) / 2 = (173 + 183) /2 = 178 cm
Median height for yr 11 girls =
(9 +1) /2 = 10th /2 = 5th = 157 cm
Median weight for yr 11 boys =
(8 +1) /2 = 4.5 = (4th + 5th) / 2 = (63 +73) /2 = 68 kg
Median weight for yr 11 girls =
(9 +1) /2 = 10th /2 = 5th = 42 kg
Range
***Year 7***
Height range for yr 7 boys = 174 – 140 = 34 cm
Height range for yr 7 girls = 166 – 125 = 41 cm
Weight range for yr 7 boys = 70 – 35 = 35 kg
Weight range for yr 7 girls = 52 – 35 = 17
***Year 11***
Height range for yr 11 boys = 194 – 152 = 42 cm
Height range for yr 11 girls = 173 – 133 = 40 cm
Weight range for yr 11 boys = 80 – 38 = 42 kg
Weight range for yr 11 girls = 65 – 42 = 23 kg
Here is a summary of the mean, median and range for year 7/11 boys/girls:
These results show that the highest average for height had the year 11 boys and girls (equivalent). The year 11 boys had the highest median height, as well as the greatest height range, highest mean/ median weight and highest weight range.
This can be concluded by saying that most boys are taller and weigh more than girls.
Measuring spread
Before I have used range (highest value – smallest value) and interquartile range (upper quartile – lower quartile) to work out the greatest distance between 2 values in a set of data. This time I will use Mean of Deviation to work out the distance of data values from the mean.
Mean height
Year 7 Boys
The mean height in cm for boys is rounded to the 2 decimal places, in order to help me better look at the spread I will round it to whole numbers, which will be 156cm.
Year 7 Boys = 11 + 8 + 2 + 3 + 12 + 6 + 16 + 3 + 5 + 9 +7 + 18 +4 + 4 + 1
15
= 109 = 7.26 = ~ 7.3 cm
15
Year 7 Girls
Mean height = 148 cm
Year 7 Girls = 0 + 3 + 7 + 10 + 23 + 16 + 8 + 3 + 0 + 18 + 2 + 3 + 2
13
= 95 = 7.30 = ~ 7.3cm
13
Year 11 Boys
Mean height = 177 cm
Year 11 Boys = 11+ 4 + 7 + 17 + 9 + 6 + 7 + 25
8
= 86 = 10.75 ~ 10.8cm
8
Year 11 Girls
Mean height = 157.33 = 157cm
Year 11 Girls = 1 + 6 + 6 + 7 + 0 + 5 +2 + 16 + 24 + 3
9
= 70 = 7.77 ~ 7.8cm
9
Looking at the data I have worked out, I can clearly see that there is a similar spread in year 7 boys and girls, even though the boys’ mean was significantly greater and logical. This can be explained, I reckon it was that girls’ heights varied more at that age, for example the lowest height was 125 whilst the heighest 166. This gave a mean of those numbers together with the other ones, however the spread was significant. The boys’ height seem to be slightly more together, however when we look at the spread, we can clearly see that the spreads are identical.
In the year 11’s case, we can see that the mean deviation for boys is enormous. This is due to a certain individual who is short, as well as another individual who is tall. When we look at girls however, their spread isn’t that great, yet it is still greater than the spreads in year 7.
Concluding from this I can say that by the time pupils get to year 11 they might grow at different rates. Also, when they reach this stage, boys tend to be significantly taller than girls.
Conclusion
- A sample of 60 students (30 from each sex) stratified over age and gender showed a mean height of 168 cm for boys and 161cm for the girls. Although the mean height for boys was greater, the range of boys’ height was also greater, which suggests that there would be boys who would be below the girls’ average, thus shorter than some girls.
- We can see that there is a positive corellation between the height and the weight, however, there are some points which do not exactly fit the pattern. This is due to some exceptions, for example a person might not be as tall, or they might not be very heavy. These are just some of the reasons.
- At a 10% sample of boys and girls, both in year 7 and 11 suggests that boys and girls in year 7 are different with a range of 8cm between. In year 11 however, I noticed this spread to increase up to 20cm, which suggests that boys tend to grow at a faster rate and are more taller than they used to be.
- The taller the person, the more they will weigh.