Mean results – boys KS2.
English
3 + 5 + 4 + 4 + 5 + 3 + 4 + 5 + 4 + 4 + 5 + 4 + 5 + 5 + 4 + 4 + 4 + 2 + 5 + 3 + 4 + 4 + 4 + 5 + 3 + 4 + 4 + 5 + 4 + 4 + 4 + 4 + 4 + 5 + 4 + 4 + 5 + 4 + 4 + 3 + 4 + 5 + 4 + 5 + 5 + 4 + 5 + 3 + 3 + 3 = 201
201 = 4.02
50
Mean for boys’ English results is level 4
Maths
4 + 3 + 5 + 5 + 4 + 3 + 4 + 4 + 3 + 4 + 5 + 4 + 5 + 5 + 3 + 5 + 4 + 3 + 5 + 4 + 5 + 3 + 5 + 4 + 4 + 4 + 5 + 5 + 4 + 4 + 4 + 4 + 4 + 5 + 4 + 3 + 5 + 3 + 4 + 3 + 4 + 5 + 5 + 5 + 5 + 4 + 5 + 4 + 4 + 3 = 208
- = 4.16
50
Mean for boys’ Maths results is level 4
Science
4 + 5 + 3 + 5 + 5 + 4 + 4 + 4 + 4 + 4 + 5 + 4 + 5 + 5 + 4 + 4 + 4 + 3 + 5 + 3 + 4 + 3 + 5 + 5 + 3 + 3 + 5 + 4 + 4 + 4 + 4 + 4 + 4 + 5 + 4 + 4 + 5 + 4 + 5 + 3 + 4 + 5 + 5 + 5 + 4 + 4 + 4 + 4 + 4 + 3 = 208
208 = 4.16
50
Mean for boys’ science results is level 4
Percentage and cumulative frequency tables for the Boys’ Key stage 2 Results
English
Maths
Science
For the boys’ Key stage 2 results, you can see from the graph that all three subjects were very close in the results that the students achieved. All three subjects had the same average level for the boys.
As you can see from the cumulative frequency table of results, most of the boys achieved a level 4 in all three subjects, which shows that the majority of boys do not excel in one particular subject.
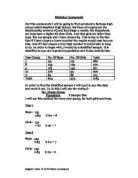
The following table shows the chart with which I worked out class widths and frequencies for the histogram that shows the results for the boys’ IQ.
I decided to use these class intervals for the construction of this histogram because they were most appropriate. The first class width started at 70 because from the information that I had gathered previously did not show any boys that were achieving below this mark in their IQ. As there were not many people who were getting between 70 and 80 for their IQ results, I decided to make the interval slightly wider to 70 – 90 points.
I used the next interval because there were quite a few people who would be put into this interval. I thought it best to have one overall interval that held the majority of students.
I chose a small interval again for the next two because it seemed that they did not contain many students.
The average IQ result for the boys was 99.
The next thing we did was to find the average for the Girls’ Key stage 2 results. Here is what we found:
English
5 + 5 + 5 + 5 + 5 + 5 + 4 + 4 + 4 + 4 + 5 + 4 + 4 + 5 + 4 + 4 + 3 + 3 + 4 + 3 + 5 + 5 + 4 + 5 + 4 + 4 + 3 + 3 + 4 + 4 + 4 + 4 + 5 + 4 + 5 + 3 + 5 + 4 + 4 + 5 + 3 + 5 + 5 + 5 + 5 + 4 + 5 + 5 + 5 + 4 = 215
215 = 4.3
50
Mean average girls’ English result is level 4
Maths
6 + 4 + 5 + 5 + 4 + 5 + 4 + 4 + 4 + 4 + 5 + 4 + 3 + 5 + 4 + 4 + 3 + 3 + 4 + 3 + 5 + 5 + 4 + 5 + 4 + 3 + 3 + 3 + 4 + 4 + 4 + 4 + 4 + 5 + 5 + 3 + 4 + 4 + 4 + 5 + 3 + 5 + 4 + 5 + 4 + 5 + 5 + 5 + 5 + 4 = 210
- = 4.2
50
Mean average girls’ Maths result is level 4
Science
5 + 5 + 5 + 5 + 4 + 5 + 4 + 4 + 4 + 4 + 6 + 4 + 4 + 5 + 5 + 4 + 3 + 4 + 5 + 3 + 4 + 5 + 4 + 5 + 4 + 4 + 3 + 4 + 4 + 5 + 5 + 4 + 4 + 5 + 5 + 4 + 4 + 5 + 4 + 5 + 3 + 5 + 5 + 5 + 4 + 5 + 5 + 5 + 6 + 5 = 223
- = 4.56
50
Mean average girls’ Science results is level 5
However, although the mean averages for the girls’ results say that the majority of girls are achieving level 4 in their key stage 2 results, if you compare this with the mode averages, then we get slightly different results.
The mode averages suggest that the majority of girls are achieving level 5 in their key stage 2 exams. (Excluding the maths results with which the average would still be level 4). The following tables show this:
Percentage and cumulative frequency tables for the girls’ Key stage 2 Results
English
Maths
Science
For the girls’ key stage 2 results, you can see by the cumulative frequency results on the graph that the marks are more spread apart, and there are more numbers of girls who are getting higher marks. This therefore shows that the girls are more able to excel in certain subjects than boys, who seem to be achieving the average mark in all subjects.
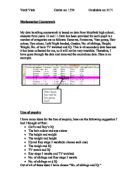
The following table shows the results that we gathered in order to complete a histogram to show the range of IQ results for the girls.
I used these class intervals for the same reasons as in the boys IQ histogram results. However, there is a difference in the last interval. This is because there were higher results for the girls than the boys, so in order to use the whole of our sample, I decided it would be best to widen the last interval slightly. The mean average for the Girls IQ results was 105 points.
Conclusion
The results that we gathered in general show that the girls from our sample are more intelligent that the boys. The girls are achieving higher key stage 2 results and higher IQ results. It is also true that the girls must put more effort into their studies in order for them to be achieving higher marks, and are therefore learning more rapidly because of this. I would like to stress that there were a few boys in our sample who did achieve above the average mark for their gender, but this was only a minority. The girls’ majority of results proved to be higher than the boys.
Therefore in conclusion, I would like to state that this does not always mean that girls are better than boys or vice versa, but that the majority of the girls would work harder to achieve good results than the boys.