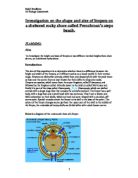
As mentioned before, one of the most influential factors affecting species distribution is desiccation or aridity. The loss of water from tissue during emersion by any relatively immobile organism, including limpets, living on the shore poses a serious threat to its survival. Patella vulgata from lower shore lose water rapidly and on average half of the population dies when they have lost 50 – 55% of their body water. On the other hand, Patella vulgata from higher up the shore lose water very slowly, but half of the population dies only when they have lost 60 – 65% of their body water. In other words, the limpets found higher up the shore have adapted to the increased risk of desiccation, or drying out, experienced at this part of the shore. In fact, limpets found on the higher parts of the shore tend to grow larger than those belonging to the same species, found at the lower shore that is closer to the water. Larger limpets have a lower surface area : body volume ratio thereby reducing the rate of water loss. Species living at the bottom of the shore (sublittoral zone) such as the Patella aspera, haven’t adapted in this manner, as the risk of desiccation is far less, consequently having the greatest rates of evaporation and usually die when 30 – 35% of their body water has been lost.
The average lifespan of a limpet varies considerably depending on environmental conditions. Where growth is fast, such as on a sheltered shore, the lifespan can be 4 to 5 years while in places of slow growth this can be up to 15 to 17 years. The limpet species Patella vulgata is said to be a ‘protandrous hermaphrodite’ as younger individuals are predominantly male until the age of about 1 year when they undergo a sex change and progressively become more female. Therefore the male limpets of this species are usually smaller than the females, and their size usually increases as they become older and more female.
Variables:
Included in this section are the output variables, which will enable us to quantify the shape of a limpet, as well as the factors affecting limpet dimensions.
The width of the base, along with the height perpendicular to the rock surface of the limpet will be measured. This will allow calculation of the width:height ratio – a value that quantifies the shape of the limpet thereby enabling a comparison to be made between sets of data by statistical analysis.
In order to carry out an experiment that is as fair and unbiased as possible, all variables other than the manipulated, in this case the nature of the shore – sheltered vs. exposed, should be kept constant. Due to the nature of the investigation, continuity of some variables is impossible to achieve and this will unavoidably hinder the overall accuracy of the procedure. Although the common species of limpet is Patella vulgata, other species of different shapes can be found on the coast of Wales such as Patella depressa, see figure 3 (page 4). However, it would be practically impossible to determine each limpet before any measurements are taken and so it will be assumed that all limpets measured are of the species Patella vulgata.
Another variable that is known to affect limpet size is vertical height along the shore. High-shore limpets grow much larger than low-shore limpets, as the risk of desiccation is greater up the shore. Larger limpets have a lower surface area to volume ratio reducing water loss. However, in this case it is possible to keep the variable constant by sampling at the same vertical height on both shores.
As mentioned in the scientific background, the growth rate of limpets is faster on the sheltered shore compared to that of the limpets on the exposed shore due to the presence of more algae on the sheltered shore. We would therefore expect to find larger limpets on the sheltered shore, see predictions. However, this should have no affect upon the width:height ratio as both the width and height should grow by the same amount.
Preliminary Work:
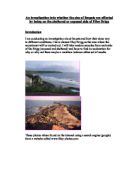
Before any practical work directly relating to this investigation was done, some preliminary work on species distribution on exposed and sheltered rocky shores was carried out.
The data sheets on pages 6 – 9 show the types of species found at different vertical heights along a sheltered shore (Sawdern point) and along an exposed shore (Manor Bier). In this experiment, ¼ m² quadrats were used to define a sampling area at a certain height. The numbers and types of species found within that area were then recorded in the previously mentioned data sheets. The Kite diagrams on pages 10 and 11 illustrate the results obtained.
Hypothesis:
There will be a statistically significant difference between the width:height ratios of limpets found on the exposed rocky shore and on the sheltered rocky shore.
Null Hypothesis:
There will be no statistically significant difference between the width:height ratios of limpets found on the exposed rocky shore and on the sheltered rocky shore.
Method:
Rough method:
Before the experiment that would obtain the necessary data for this investigation was actually carried out, a brief plan was written out, see page 13. Note that the procedure outlined in the rough method is not exactly the same as the one written below. For example, in the rough method it states that the height:width ratios would be calculated while in the actual experiment the width:height ratios were calculated as it soon became apparent that the width of a limpet is greater than it’s height. The range of values indicating limpet shape would otherwise have been too narrow so that a comparison between limpet shape on exposed and sheltered shores would have been more difficult.
Apparatus:
¼ m² quadrat, 20m tape measure, 0.6 cross staff, vernier callipers, tide tables, calculator, plastic bag, data record tables (see page 14 for the original version), pencil.
Procedure:
In order to sample at the same vertical height along the shore, we needed to have a reference point of known vertical height above sea level, from which the vertical height along the shore could then be determined. This was chosen to be the lowest tide of each day, the height of which was obtained from the tide tables. For day 1 (18th November 2002), the lowest tide was 1.4 metres above sea level at 11.20am, and for day 2 (19th November 2002) this value was 1.2 metres above sea level at 11.53am. It had been decided to sample at middle-shore, due to the increased numbers of older, and therefore larger, limpets at that location. A greater sampling size improves accuracy, and measurements of greater magnitude reduce the uncertainty values associated with them, see pre-evaluation. To reach the middle-shore, the technique of cross staffing was practiced. This involved one person standing at the waters-edge during low tide, using a cross staff to direct another person to a point that is around 0.6 metres vertically higher up the shore, see diagram below. When using the cross staff, we made sure that it was kept level by regularly checking that the air bubble was midway on the scale.
Figure 4– the cross staffing technique
This procedure was repeated four times on both days so that a vertical height of around 2.4 metres (0.6 x 4) above low tide was reached.
On day 1, sampling was done at a vertical height of 3.8 metres (2.4 + 2.4) above sea level along an exposed rocky shore. Once this height had been reached through cross staffing, a 20 metres tape measure was placed horizontally along the shore and held in place using native rocks, see photo 1 on page 16. It was necessary to cross staff back to the waters-edge from different positions along the length of the tape in order to ensure that it had been placed at the same vertical height. Next, the left side of a ¼ m² quadrat was placed at the 1m position on the tape measure, and the base width and height perpendicular to the rock surface of each limpet in the quadrat was measured, see photo 2 on page 16. Vernier callipers were chosen to measure these lengths due to their superior accuracy – they are accurate to ±0.1mm while the common ruler is accurate to ±1.0mm. The callipers were modified by attaching quite stiff ductile tape to the bottom, see photo below, so that the height of the limpet perpendicular to the rock surface could be measured more accurately.
Photo 3– modified vernier callipers being used to measure the height of a limpet:
As soon as the height and width of a limpet had been measured, the width:height ratio was calculated on site using a calculator, as well as the latest running mean, that is the mean width:height ratio of all limpets measured so far. When the value for the running mean had begun to stabilise, the value for the number of measured limpets was doubled. This figure represented the minimal sample size that would ensure a satisfactory degree of accuracy.
Once all the limpets in one ¼ m² quadrat had been measured, the quadrat was placed 1 metre further along the tape measure, making sure that the left side was positioned at the metre mark. This sort of systematic sampling, known as an interrupted belt transect, was chosen as it prevents sampling in the same area twice, which may result in the same limpet being measured twice so that the results are not to standardised. This was continued until the minimal sample size had been exceeded.
On day 2, the interrupted belt transect was set up at 3.6 metres above sea level (2.4 + 1.2) on a sheltered rocky shore. The same procedure outlined above was repeated.
Locations:
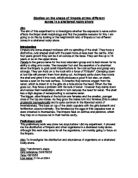
The exposed rocky shore on which this field experiment was carried out on 18th November 2002 was at West angle bay, grid reference SM 852 032.
The sheltered rocky shore used on 19th November 2002 was at Angle point, grid reference SM 875 033.
Safety assessment:
There are several safety risks associated with doing fieldwork on any type of shore that must be mentioned. For example, tidal cut-off can happen quite easily especially when one is concentrating fully on a particular part of the shore. To prevent such a potentially dangerous situation occurring it is prudent to check the position of the tide along the shore on a regular basis.
Bearing in mind the time of year, wind-chill can also be considered as a safety risk, certainly by the sea. Wearing several layers of clothing as well as waterproofs to keep dry, helps to prevent catching a cold or worse.
Finally, there is a lot of slippery seaweed on the shores so it is safer to wear boots that have a good grip in order to avoid falling over.
The rocks at Angle point are very steep and slippery, much more so than at West angle bay, and any slip may result considerable physical body damage, see photo 1. Again, having boots with good grip is strongly suggested and caution is advised.
Predictions:
Based on the knowledge and understanding put forward in the scientific background, a prediction concerning limpet shape on exposed and sheltered rocky shores can already be made.
We would expect that the width:height ratios of the limpets on the exposed shore are, on average, greater than those of the limpets on the sheltered shore. In other words, we would expect to find limpets with a larger base compared to its height on the exposed shore, as they are exposed to more wave action. The risk of losing attachment to the rock surface due to exposure to intense and powerful wave action is much greater on an exposed shore than on a sheltered shore. Therefore limpets living on exposed shores would have adapted by growing a wider than normal base. Such a structure seems to be advantageous as it is more stable as well as increasing the area of the limpet foot thereby resulting in increased tenacity. Note that it may also be the case that limpets found on the exposed shore will, on average, be shorter than those on the sheltered shore. A taller limpet has a less hydrodynamic shape so it would be more advantageous to be shorter where the water flow is greatest, i.e. at an exposed shore, to reduce the risk of being overturned. Again this would result in larger width:height ratios at the exposed shore.
We would also expect to find larger limpets, i.e. width and height values of greater magnitude, on the sheltered shore than on the exposed shore as it was noticed that there were more algae at Angle point than at West angle bay. Limpets feed on microalgae and will consequently have more energy to grow faster if there are more algae, see scientific background. An increased growth rate results in a greater number of larger limpets at a single point in time.
Pre-evaluation:
As mentioned under the section headed ‘variables’, some factors that are known to affect limpet shape, such as species, could not be kept constant. Although possible, it would be too difficult to determine the species of each limpet that is measured due to time constrictions. This will undoubtedly decrease the accuracy of the data obtained and therefore also the reliability of any conclusions based on these results.
In this investigation we will be comparing the shape of a limpet, dependant variable, on a sheltered rocky shore with those on an exposed rocky shore. It will be impossible to set up a control experiment, as the independent variable, namely the nature of the shore, cannot be given a zero value. As a result, any comparison made based on the analysis of the data obtained, will be less accurate.
Finally, the accuracy of any measurements made will inevitably be limited by the accuracy of the apparatus used. For this reason, a vernier calliper was used as it is accurate to ±0.1mm rather than a ruler accurate to ±1.0mm. However, there will still be a percentage uncertainty associated with each measurement. This can be calculated as follows:
Say height of a given limpet is measured to be 12.30 mm, therefore
percentage uncertainty = accuracy x 100 = 0.1 x 100 = 0.813%
reading 12.30
The experiment was designed so as to reduce the percentage uncertainties associated with each measurement, so that overall trends in the data will still be accurate enough to make reliable conclusions. In other words, the systematic error, that is the error resulting from apparatus, will have no significant effect upon the accuracy of the results.
Title: Investigation into the shapes of limpets on sheltered and exposed rocky shores.
Tables and graphs:
The data obtained in the experiment is tabulated on pages 19 and 20, showing the width, height and width:height ratio of each limpet measured. The width:height ratio was calculated by diving the width of the limpet by its height such that a large width:height ratio represents a greater width and/or smaller height. 32 limpets in total were measured on the sheltered shore while on the exposed shore 35 limpets were measured. The mean width:height ratio at each shore could therefore be calculated as 2.44 at the sheltered shore and 3.29 at the exposed shore.
As mentioned in the method, the running mean of the width:height ratio was also calculated on site each time another limpet was measured. The graphs on pages 21 and 22 show how this running mean varied at the sheltered and exposed shores respectively, as more limpets were measured and more values for width:height ratio were included in the calculation. One can notice that at the sheltered shore, the running mean of the width:height ratios had stabilised after 8 or so limpets were measured, as most values for width:height ratio thereafter are within 2.5% of the mean (2.44), that is within a range of 2.501 – 2.379. Therefore a sample size of 32 far exceeds the minimum sample size of 16, ensuring a satisfactory degree of accuracy. The running mean at the exposed shore stayed within 5% of the mean (3.29) that is within a range of 3.455 – 3.126 (3 sig. fig.), after about 17 limpets had been measured. So a sample size of 35 should ensure a satisfactory degree of accuracy.
Preliminary Conclusion:
Using only the data tables and graphs a simple trend can already be observed without the need for further analysis.
It is clear that on average, a limpet on the exposed shore has larger width:height ratio than its counterpart on the sheltered shore, as the mean width:height ratio is greater on the exposed shore (3.29) than on the sheltered shore (2.44). Note that this doesn’t necessarily mean that the width of a limpet on an exposed shore is greater than on a sheltered shore. In fact the data shows quite the opposite – mean width of limpet on sheltered shore is 26.0mm while it is 20.5mm on exposed shore. This suggests that the limpets found on the sheltered shore are indeed larger than those found on the exposed shore, as was predicted on page 17. One can see from the tables on page 19 and 20 that the values for width and height are greater in magnitude for limpets on the sheltered shore than those on the exposed shore. It was mentioned in the scientific background, that there is usually more algae present on the sheltered shore resulting in increased growth rates and so larger limpets. This statement correlates with the evidence so one can conclude that the presence of more algae result in larger limpets.
Statistical Analysis:
In order to show that there is a statistically significant difference between the shapes of limpets, as quantified by their width:height ratio, on exposed and sheltered shores it is necessary to perform further mathematical analysis. When testing for any statistically significant difference between two sets of data, being the width:height ratio on sheltered and exposed shores in this case, a T – Test is usually carried out, see page 24. To calculate the t value the mean and standard deviation (a value for the spread of the data) of each set of results are worked out. Next, the value of t is calculated using the formula given on page 24. In order to interpret the resulting t value the critical value must first be determined. This takes into account the level of significance of the results used, that is the probability that the differences between the measured values and the actual values are due to chance, and the number of comparisons made between measured and actual values also known as the degrees of freedom, similar to the chi-squared test learnt at A2 level. In this experiment, the level of significance is equal to 0.05, the standard value used in biological experiments, and the degrees of freedom is 65 as calculated on page 24. Using the table of T-distribution, see appendix 1, the critical value for this experiment can therefore be shown to be 2.000. The t value was calculated to be 7.20.
Conclusion:
Interpretation of the T – Test reveals that there is a statistically significant difference between the width:height ratios of limpets found on a sheltered shore and those found on an exposed shore, as was originally stated in the hypothesis. In other words, any differences observed between data collected at the sheltered shore and that collected at the exposed shore are not due to experimental inaccuracies. This is because the calculated t value of 7.20 is above the critical value (2.000) confirming that there is a statistically significant difference. Therefore the earlier conclusion stating that limpets found at the exposed shore have, on average, a larger width:height ratio than those found at the sheltered shore is shown to be valid.
The fact that limpets on exposed shores where there is more wave action, have a larger width:height ratio than those on sheltered shores where there is less wave action, suggests that these organisms have adapted to their environment. This concurs with the predictions made on page 17. The growth of a wider than normal base results in a structure that is more stable as the centre of mass is closer to the ground, as well as increasing the suction area of the limpet foot. Both these factors would increase the chances for a limpet to remain attached to the rock surface in spite of the intense and powerful wave action it experiences on an exposed shore. Notice also that the average height of a limpet found on the exposed shore is much less than that of one found on the sheltered shore. It was mentioned in the scientific background that limpets have a hydrodynamic shape that reduces the resistance to water flow. However, limpets of greater height would not be as hydrodynamic and so would experience more pressure due to the water flow, like an obstacle in its path. These organisms would more likely overturn especially under conditions of increased wave action.
The wave action can thus be regarded as a selection pressure, selecting against taller limpets with lower widths, i.e. lower width:height ratio, but in favour of shorter limpets with greater widths, i.e. larger width:height ratio. For this reason, fewer limpets with lower width:height ratios are found on an exposed shore as they are more easily dislodged, and more limpets with larger width:height ratios are found as these survive. This is an example of natural selection. A similar example of natural selection is industrial melanism. Before 1849 most peppered moths (Biston betularia) were white and speckled in appearance. However, after 1849 the frequency of the black (melanic) form of Biston betularia increased dramatically but only in the industrial areas. The reason being that industrial pollutants killed the lichens growing on nearby trees so that birds could easily spot and eat the now non-camouflaged white peppered moth but not so easily the camouflaged black peppered moth which were both found on these trees. This meant that the white peppered moth most likely did not survive to reproduce and pass on its genes while the melanic form did. Therefore over several generations there was a change in allele frequency – the allele coding for the melanic (black) form became more common within the population whereas before 1849 the allele coding for the non-melanic (white) form was more common. Note that the allele coding for the melanic form had always been present in the peppered moth population.
If there is a similar change in allele frequency in a population of limpets, then there should also be limpets with larger width:height ratios found on the sheltered shore. Indeed, there are three limpets of greater width:height ratio than the mean width:height ratio of limpets found on the exposed shore (3.29). These are limpet numbers 2, 21 and 27 with width:height ratios of 3.41, 3.40 and 3.48 respectively – see table 1, page 19. One could also argue that limpet numbers 5 and 19 also have relatively large width:height ratio (more than 3.00) similar to those found on the exposed shore. This data suggests that there is an allele responsible for a larger width:height ratio, either by reducing the height or increasing the width or both, that is always present in population of limpets. However, we cannot be certain of this without further investigation. It may be the case that there is no allele coding for a large width:height ratio. Rather the conditions on the shore to which the limpets are exposed, cause them to grow a larger width:height ratio.
In conclusion, the evidence collected suggests that there is a statistically significant difference between the shapes of limpets found on sheltered rocky shores and those found on exposed rocky shores. Therefore we accept the hypothesis made earlier on page 5. The evidence also shows that the width:height ratios of limpets found on exposed rocky shores are in fact on average greater than the width:height ratios of limpets found on sheltered rocky shores.