See Graph 3
See Graph 4
See Graph 5
See Graph 6
See Graph 7
See Graph 8
Can’t use as its the same as number 22
See Graph 9
See Graph 10
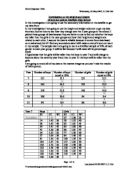
I am now going to work out the mean and standard deviatons for the data that I have collected.
Year 7 boys
Mean: 142 + 145 + 141 + 136 + 152 + 164 + 136 + 147 + 173 + 158 + 146 + 162 + 160 + 152 + 160 = 2274 ÷ 15 = 151.6 = 151 (to 3 s.f.)
Standard Deviation:
√9688.72 ÷ 15 = 6.562086389 = 6.6 (to 2 s.f.)
year 7 girls
Mean: 156 + 152 + 161 + 162 + 161 + 158 + 148 + 159 + 163 + 148 + 158 + 165 + 150 = 2041 ÷ 13 = 157
Standard Deviation:
√400 ÷ 13 = 1.538461538 = 1.5 (to 2 s.f.)
Year 8 boys
Mean: 165 + 177 + 170 + 152 + 172 + 167 + 186 + 142 + 154 + 165 + 162 + 152 + 136 + 152 + 174 = 2426 ÷ 15 = 161.7333333 = 162 to (3 s.f.)
Standard deviation:
√1952 ÷ 15 = 11.40759981 = 11 (to 2 s.f.)
Year 8 girls
Mean: 157 + 160 + 155 + 152 + 155 + 155 + 168 + 162 + 172 + 160 + 165 + 145 + 140 = 2046 ÷ 13 = 157.3846154 = 157 (to 3 s.f.)
Standard deviation:
√1499 ÷ 13 = 2.97822472 = 3.0 (to 2 s.f)
Year 9 boys
Mean: 160 + 156 + 166 + 166 + 165 + 152 + 167 + 171 + 180 + 173 + 155 + 177 = 1988 ÷ 12 =165.6666667 = 166 (to 3 s.f.)
Standard deviation:
√846 ÷ 12 = 2.423839929 = 2.4 (to 2 s.f.)
Year 9 girls
Mean: 152 + 162 + 153 + 160 + 157 + 149 + 162 + 164 + 158 + 160 + 148 + 163 + 165 + 157 = 2075 ÷ 14 = 148.2142857 = 148 (to 3 s.f.)
Standard deviation:
√1254 ÷ 14 = 2.991484513 = 3.0 (to 2 s.f.)
Year 10 boys
Mean: 163 + 175 + 166 + 180 + 175 + 155 + 172 + 180 + 155 + 175 + 165 = 1861 ÷ 11 = 169.1818182 = 169 (to 3 s.f.)
Standard deviation:
√812 ÷ 11 = 8.591750801 = 8.6 (to 2 s.f.)
Year 10 girls
Mean: 173 + 173 + 172 + 179 + 171 + 175 + 163 + 173 + 190 = 1569 ÷ 9 = 174.3333333 = 174 (to 3 s.f.)
Standard deviation:
√419 ÷ 9 = 2.274387721 = 2.3 (to 2 s.f.)
Year 11 boys
Mean: 167 + 180 + 175 + 185 + 162 + 167 + 160 + 170 = 1366 ÷ 8 = 170.75 =
171 (to 3 s.f.)
Standard deviation:
√532 ÷ 8 = 2.883140649 = 2.9 (to 2 s.f.)
Year 11 girls
Mean: 183 + 155 + 172 + 173 + 169 + 172 + 168 + 161 + 163 = 1516 ÷ 9 = 168.4444444 = 168 (to 3 s.f.)
Standard deviation:
√526 ÷ 9 = 2.548298876 = 2.5 (to 2 s.f.)
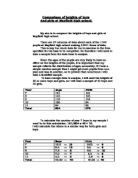
I am now going to make a table of results to help me compare them.
I think that my hypothesis for year 7 is correct because the medians show that the middle values are bigger for the girls than the boys but it also shows that the other values are quite a lot closer than the ones for the boys so overall the girls are taller as well. The means also show that the boys are smaller than the girls by a lot. The upper and lower quartiles are also higher for the girls than the boys. Aslo the interquartile range shows there is less dispertion over the boys and the girls.
In year 8 the data for the boys starts to get closer to the girls data the medians are a lot closer but the standard deviation is a lot bigger than the girls so overall the girls are taller because they are not as spread out as the boys. The upper quartile and lower quartile also get a lot closer together for the boys and girls as well. Although the interquartile range is still a lot higher than the girls which again shows a larger dispersion in the boys data than the girls.
In year 9 the medians start to get further away from each other again but the boys data value is now higher than the girls and so are taller by this point. The standard deviation for this data is a lot less and the boys have less dispertion than the girls. The upper quartile is also higher than the girls but the lower quartiles are the same as each other. The interquartile ranges for the data are also very different than than the other set.
In year 10 the girls median is bigger than the boys and so is the mean so the girls are taller than the girls again. The the standard deviations are totally different again and the boys is larger than the girls which shows a smaller dispersion than the boys.this is also shown by the interquartile ranges. The upper and lower quartiles are also larger for the girls than the boys.
In year 11 my hypothesis is incorrect because the median shows hte boys re smaller than the girls but the mean shows the boys are taller so I think they are about the same as each other. The standard deviations are about the same so I think the pupils have stopped growing so much by then because they level out and have roughly the same standard deviation which shows that they have the same dispersion of the data. The upper and lower quartiles are also roughly the same as each other and the interquartile ranges are almost exactly the same as each other.
Page of
Last printed 02/05/2007 2:13 AM
Y:\svn\trunk\engine\docs\working\acumen3\34253.doc