Investigation
1 Line
For 1 line the maximum you can have is 0 crossovers 0 closed spaces and 2 open Spaces.
2 Lines
As you can see the maximum for 2 line is 1 crossovers 0 closed spaces and 4 open spaces.
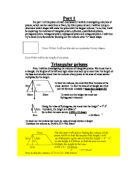
3 Lines
4 Lines
As you can see the maximum for 4 lines is 6 crossovers 3 closed regions and 8 open regions.
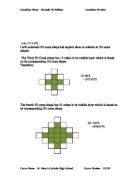
5 Lines
As you can see the maximum for 5 lines is 10 crossovers 6 closed regions and 10 open regions.
6 Lines
As you can see for 6 lines the maximum you can have is 15 crossovers 10 closed spaces and 12 open spaces.
Results
During my investigation I found some data displayed in the below table.
As you can see from this table you can already see patterns emerging on the below table I have labelled the patterns.
From this I have produced 2 formulas all ready.
Open Regions = linesX2
Difference Between X/C = lines-1
When I found these two formulae I looked for patterns in my data and then tried to relate them to some thing else in my graph if the pattern is steady i.e. all ways goes up by 2 you can easily relate it to the amount of line to form a formula.
Crossovers = Lines /2 – Lines/2
This formula I found finds the maximum amount of crossovers for each amount of lines I have tested it and it works perfectly.
This formula tells me how many total regions each set of lines has in total.
Regions = lines X (lines+1)/2 + 1
I produced this formula so I don’t have to work out how many closed regions there are by subtracting- my open regions formula with my total regions formula I did this but in a formula.
Closed Regions = (Lines X (lines +1)/2 + 1) - (LinesX2)
From all the formula, I can guess the amount of lines, crossover and regions for any amount of lines as bellow so I can see if my data was the maximum.
As you can see my crossover formula did work and I have run out of time so I cannot continue to investigate yet I think my investigation has been a success.
I use my formulae to produce this table bellow.
Conclusion
During my investigation I have found enough formulas to find data for X amount of lines it was a massive success the process I used to find the formula clearly worked and I found it quite easy. If I did this investigation again I would investigate with lines up to 10 for a more in-depth investigation and I would have produced more graphs and tables other than that I think that my investigation was a success.
During my investigation I learnt that graphs and tables are the ultimate way to find otherwise hidden patterns, which with a bit of work will lead you to formulas.
I have also learnt that you should carry out a limited investigation in depth rather than carry out a complicated investigation baisicly.
This document was downloaded from Coursework.Info - The UK's Coursework Database
Click here to visit Coursework.Info/