My hypothesis based on my data would be; the magazine article and the newspaper article should have approximately the same length of words.
The data
Magazine article
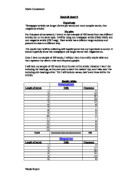
Calculating the mean: frequency x number of letters total
Frequency total
= 485
- = 4.85 letters/word
Calculating the mode: 2 and 3 letters/word
Calculating the median: 4letters/word
Calculating the range: UQ-LQ = IQR
6 - 3 = 3
Calculating the range: 11-1 = 10
Newspaper article
Calculating the mean: frequency x number of letters total
Frequency total
= 484
- = 4.84 letters/word
Calculating the mode: 4 letters/word
Calculating the median: 4letters/word
Calculating the range: UQ-LQ = IQR
6 - 3 = 3
Calculating the range: 10-1 = 9
Shown in Box and Whisker diagram
Analysis
From the box and whisker diagram it is clear my results are very similar. The middle 50% is identical, only the range is slightly varied. The mean is also very similar. These results support my hypothesis in which I said they should be the same. The average word is 4 letters long; we can get this information from the mean. This would be different if you collected a foreign language paper or magazine as the English language is made up of lots of little connecting words e.g. They, this, them, with.
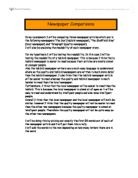
I have decided to investigate further as my results are so similar. I am going to investigate to see if sentence length in magazines will be shorter then newspaper sentence.
Sentence length
My hypothesis:
I think that magazine sentences will be shorter than newspaper sentences
I think this because newspapers are read quickly and briefly, not the columns. People spend more time reading magazine articles. If sentences are longer they can be read quicker, I took my samples from a newspaper and the newspapers magazines. I chose two articles based on the same subject I chose in this way, as it is the most unbiased way. I counted the first 50 sentences. Sampling in a non-bias way gives me clearer and more reliable results. I recorded my results in a tally chart. My hypothesis is based on my results and could be different if you collected your data from a different source. I plan to record my data in a cumulative frequency graph as from this I can read off the median, upper quartile and inter quartile range.
Histogram
Newspaper
Histogram
Magazine
The results
I can also display this data in a cumulative frequency curve.
Analysis
Box and Whisker diagram
From the box and whisker diagram and the cumulative frequency graph I can tell that newspapers have longer sentences. My hypothesis was correct. The newspaper article had a much larger range; some sentences were very short while others very long. The magazine article had a smaller range and all the values were less. Magazine articles in general are longer than newspaper articles. Newspaper articles are read quickly and people take a shorter amount of time over them, they are generally shorter. To get a more accurate conclusion one would have to do a census of all newspapers and magazines, as this would be very hard you could do take more than one set of data.