The theoretical ranges for the horizontal velocities are calculated using the equation:
Range = horizontal component x time taken to fall from vertical height above ground.
The projectile is fired from rest, and falls freely under the influence of gravity, thus using the formula for the equation of motion: s = ut + 1/2at2
s = 0 + ½ x g x t2
t = √(2s/g) where s is the vertical height above the ground and g is the projectile free falling under gravity, taken as 9.81ms-2.
Interpretation of the graphs
Five graphs have been drawn each comparing the theoretical range to the gathered experimental range of a projectile at various horizontal velocities of the five different vertical heights above the ground. It can be clearly seen (by straight lines of best fit), that in each graph, an increase in horizontal velocity leads to an increase in the range produced (although on the graph which shows a vertical height of 0.5m, the range decreases in places- these can be assumed as discrepancies and will be discussed later).
The trend can be justified using the formula:
Range = horizontal component x time taken to fall from vertical height above ground.
Where time is constant for the same vertical height, an increase in the horizontal component will lead directly to an increase in the range.
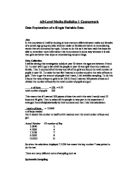
It is now possible to compare the ranges produced with certain horizontal velocities for different vertical heights above the ground. Using my lines of best fit, several readings have been taken in order to compare this:
From the graph, it can be seen that the greater the vertical height, the greater the range when projected at the same horizontal components. Again using the formula:
Range = horizontal component x time taken to fall from vertical height above ground, where the time must increase with vertical height since the horizontal component is the same.
From understanding the formula to calculate time, t = √(2s/g), it is clear that the greater the vertical height above the ground (s), the longer it will take the projectile to reach the ground, leading to a larger range.
There is a slight oddity in the trend of the graphs, in the sense that the plots for 1.0m and 1.5m are extremely close together. The most likely explanation for this is due to the fact that only four readings were taken for 1.0m. Hence, the line of best fit has been used through these points which is highly likely to be as accurate as 1.5m, which has 6 plots gathered from the experiment, all of which coincidentally are close to the line of best fit.
Sources of error
The reasons for why some of the readings produced from the secondary data were some distance away from the theoretical readings may be due to possible errors that may have arose when carrying out the experiment. Some possible sources of error are:
-
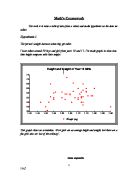
The faster the projectile is fired i.e. the greater the horizontal velocity, the greater the wind resistance. This indicates that at the largest velocities, the recorded ranges may be smaller than they should be. From the graph of a vertical height of 0.5m, it can be seen that the recorded range has decreased from 4.95m-4.85m when the horizontal component is changed from 14.5ms-1-15.8ms-1.
- The accuracy of measuring the vertical height may lead to discrepancies. For example, by using a tape measure or ruler, one may expect there to be inaccuracies of +1mm or –1mm. This may not seem large, but for measuring 0.25m this is a 0.4% error which may be doubled if the error is by 2mm. This factor may be a contribution towards the reason why the plots for a vertical height of 0.25m have a large deviation from the line of best fit. This source of error may also demonstrate some plots just missing the point on the line of best fit.
- The two graphs showing 1.0m and 2.0m both have limited readings, and both have ranges in excess of 5m. Visually it can be seen as a difficulty to watch precisely where the projectile has landed. Inaccuracies of 3cm or more would be expected due to this.
-
On top of the above factors, the ability to fire the projectile at a high velocities horizontally leaves a prospect that the projectile may accelerate after a reading of its velocity has been recorded on the light gate, due the force exerted on blowing. Consequently, values may be larger than expected, as can be seen for a vertical height of 0.5m when at 13.1ms-1 the range is 4.70m.
These points are not all the possible sources of error that may account for slight discrepancies or anomalies, however they are the main factors.