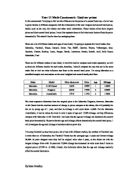
The list shows the Vauxhall cars with the depreciation rate price and age. We cannot find the relationship between age and depreciation through a table so I will use a scatter diagram to compare these data.
I have to remember that afterwards I must use the best fit line and the scatter diagram to predict what is the depreciation rate if its x amount of years .
In the scatter diagram and the best fit line below I can see that there is a weak relationship and a negative correlation with the depreciation rate of Vauxhall cars and their age; as the age of car gets older, the depreciation rate decreases (i.e. the 5 year old car with 19.5% depreciation rate compare to a 10 year old car with 4.6% depreciation rate). I can infer from this that if any cars that are over the age of 10, there will be depreciation rate less than 10% for them. I can test this with another make of a car.
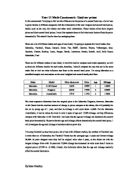
I will use all the cars that have the age of 10 years or above as a stratified sample to test my prediction, this is because I am trying to find out if my prediction on whether cars that are 10+ years of age have 10% lower depreciation rate.
From the list above it shows all the cars with 10 years of age or above, the Volkswagen Golf is the oldest in age (15 years) but there is no original price. So the results will vary due to this. The scatter diagram here shows that all of the cars with 10 years + all have a depreciation rate of less than 10%, except for Volkswagen Golf, which we are uncertain. However, overall, I can clearly say that cars with 10 years of above of age will definitely have the price depreciation rate of 10% of below.
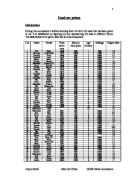
The length of MOT should relate to the age and mileage of the car, as if the length of the Mot is n/a, it means that the car is still relatively new, as proved for the Ford Orion with only 1 year old and with n/a MOT.
Cars with N/A or low MOT should then proves that the second hand price is still relatively high and no a lot of differences from their original price, I’ll check this.
The table shows that all the cars with N/A MOT are all below 2 years of age and that their mileage is average of 14888, from earlier investigation, we learn that low mileage of cars means still relatively high second hand prices. All the cars are still quite mechanically reliable, which suggest that their second hand prices are still relatively high, with the average of £9898, this shows that n/a or low length of Mot means the second hand price of cars are still quite expensive.
MOT, mileage and year of the car shows that second hand prices will drop from their original price a lot more when length of these factors are long (as few examples shown below)
With comparison with the MOT of N/A cars, these above cars have shown that their second hand prices have dropped consistently as they are older and with more mileage and higher MOT. From all this we can prove at the moment that the age, mileage and MOT of the cars have the same affect on the second hand prices of the cars, these factors affect the quality and mechanic reliability of the car, which causes its second hand price to dropped. I shall investigate the rest of the factors that affects the mechanics of the car to see if they influence the second hand prices as well, these will be the engine, fuel, MPG, central locking, gearbox and airbags.
I will first look the actual mechanics factors that affects the cars’ performances when driving first to determine whether they affect the second hand prices, these are the fuel, engine, gearbox and MPG. I have filtered all the rest of the data except all those mentioned in this paragraph and the cars’ original and second hand prices. I will also randomly select a make of a car since there are too many different makes of the car to find out their differences in MPG etc, so I’ve selected Ford randomly and use it to find out about the fuel, engine, gearbox and MPG.’s relationship with the second hand price.
From this scatter diagram it shows that there is definitely a positive correlation or relationship between the fuel and the outcome of the second hand prices for engine, showing that as engine size increases there is a higher price, though there is a separate group where they have similar engine size with the other but costing around 8000 pounds, this probably be influenced by their individual age/MOT, as they might be still relatively new cars. This again proven as well that the MOT, age etc can have more influence on the second hand prices than the engine size.
From just observing the table, we can see that there are not different choices of fuel or gearbox, which suggests that those two factors do not really influence the second hand prices, as they are really chosen fro what the consumers prefers, this leave us to only compare the MPG only.
The MPG has the ranges of miles per gallon that the car can go; this means I have to find the median for the range so that I can get the average MPG fro each car. From the scatter diagram, we can see that there is a slightly negative correlation, as the lower the MPG is, the second hand prices increases, this is probably because higher MPG means the engine is not very efficient, the car needs more fuel to work, and lower MPG means he car needs less fuel and still can go the distance it is going compare to cars with higher MPG.
Finally, safety and security factors such as airbags, insurance, service and central locking system will influence the second hand prices as these ensure that the cars are not easily damaged, I will select 10 cars with airbags, insurance, service and central locking and 10 cars without compare them.
Random list of cars with central lock or airbags
Random list of cars without central lock or airbags
From this I can work out that the average second hand prices for the cars WITH central locking and airbags are £6178, while the average for WITHOUT central locking and airbags are only £1482. This shows dramatically that cars without central locking or airbags are originally very cheap and their second hand prices are not different. I will now investigate about the factors of insurance and services.
I can suggest that the insurance and services will have a big influence to the second hand prices of cars as they are very important for car drivers; I predict that the higher group off insurance will mean that the prices of cars will be higher.
From this I can learn that there is a very positive correlation, showing that lower cost cars have a lower insurance group, meaning that not everything will be insured or as much as the higher groups. Few cars with insurance group 20 shows that they are more expensive even in second hand price than other second hand prices, especially the car costing £40,000. Following this, I predict that services for cars will affect the second hand prices. As services of cars means they are looked after or not, so it is similar to whether the car has insurance, and if the car is serviced, it will raise the second hand price of the cars, so this is unnecessary to investigate further.
We can go further investigation to find factors that are optional and do not directly affect the driving performances, factors such as air conditioning, style of cars, no. of doors, taxes, and colour may have big influence of second hand price. At first I will investigate the prices of cars compare with colours and style. I will first choose 5 random cars that have all the same colours, and I will choose list of 5 cars from all the different colours available.
The average price for:
Black- 6018
Blue-4769
Cuirass - 7995
Gold -3995
Green- 5372
Grey- 6289
Marine- 7499
Red- 5056
Silver-6208
White- 2420
Conclusion
From this I can instantly infer that other factors such as no. of doors and style of cars does have influence on the second hand prices, however as proven earlier that not only a single factor can affect the second hand prices of the car, but different factors can both lower or raise the price, also, as there are so much different models and makes of cars, it is hard to determine exactly how much influence are there in each factor to prove exactly how much they affect the prices. From all this information though I can summarize that mileage, insurance and colour- physical appearance of the car definitely have a more dramatic influence on the 2nd hand prices than other factors such as airbags or type of fuel. However, factors such as mileage relates to the age and length of MOT of a car, these factors relate and give the same results to the cars’ price, so these cannot be compared.
Overall from this, I have found out that what influence the second hand price the most is the insurance, as it is has the most positive correlation, but mechanics and appearances factors also influence a lot.