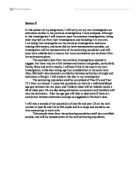
Graph 1
Clearly showing the price of each album on release.
To gather the albums worldwide and US and European sales I did some secondary research and gathered them with some chart positions. Being Careful not to include download charts or download sales. The Album sales and Chart Positions came from www.wikipedia.org and the album names came from . (See table 1)
Graph 2
Graph 2 is showing worldwide sales compared to price. I couldn’t see much of a correlation from this graph so I carried out Spearmans Rank Correlation Coefficient. Spearmans rank gave me 0.647566985 which told me there was a positive correlation and that price does effect the number of sales. Again, using Spearmans, I compared the average chart position of each album to its worldwide sales. I found out that there is a strong negative correlation between the two as the correlation is -0.671986877. However, because Spearmans ranks higher numerical values 1st the lowest chart position was the highest so in fact the correlation should be 0. 671986877 so there is actually a positive correlation.
From this I can gather that album sales are affected slightly more by chart positioning than price.
Graph 3
Showing price increase over time.
Table 2
Showing the sales of each album over each year for three years.
Another factor that I noticed influenced album sales was the price. I gathered the album sales for the three years in which they sales were recorded. However, for the last album there was no information gathered for 2008 so I had to predict it by calculating the mean decrease in price between the 2nd and 3rd year of sale and taking it away from the 2nd year’s sales.
With the age of the artist I realised that the older the artist gets the more CD’s are sold (positive correlation), I presume this is because the artists fan base gets bigger as the band gets older.
The cumalative frequency graph shows us that as the band gets older the sales of each of the albums increase. We also notice that the increase in sales between each year gets slowly steeper, which means more albums are sold the older the band gets.
However, I also noticed that the last album, Stadium Arcadium, experienced a drop in sales, despite the band being older, the price being highest and it having the highest average chart ranking. I discovered, by finding out about other bands, that in 2006 high street CD sales slumped by 20%. I believe this is because of Internet downloads as they can be obtained cheaper or even free. On the other hand, the album One Hot Minute experienced a fall in sales, but this appears to be because the album had low chart ratings and the correlation shows that albums with higher chart positions have higher sales.
Table 3
Showing average chart position.
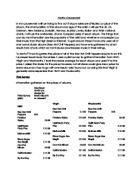
Table 1
Showing worldwide, US and European sales and different albums
Overall, I have shown that album sales are affected by price, chart positioning and the age of the artist and I have come to the following conclusions. Price affects the album sales and it is a guide to the buyers of how good the album is, but if the buyer can get the album cheaper through download they will. The most important factor in my opinion is the chart positioning, as it gives the general public an idea of what the album will be like so they will buy it if it has a high ranking. As well as this, Spearmans rank shows us that this is the factor that most affects albums sales as average chart position and worldwide sales had the highest correlation. The other item that affects sales is the age of the band, this also has a lot to do with its popularity, but as the band gets older it gathers more fans and a bigger reputation, which in turn leads to a higher amount of album sales.