Maths coursework - car prices
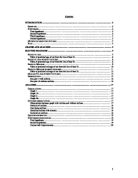
Contents
INTRODUCTION 2
SAMPLING 2
HYPOTHESIS 2
First hypothesis 2
Second hypothesis 3
Third hypothesis 3
Fourth hypothesis 3
METHOD ON REMOVING OUTLIERS 4
PLAN 4
GRAPHS AND ANALYSIS 5
SCATTER DIAGRAMS 5
PRICES VS. AGE 5
Table of predicted age of car from the line of best fit 7
PRICES VS. AGE WITHOUT OUTLIERS 7
Table of predicted age of car from the line of best fit 8
PRICE VS. MILEAGE 9
Table of predicted mileage of car from the line of best fit 10
PRICE VS. MILEAGE WITHOUT OUTLIERS 11
Table of predicted mileage of car from the line of best fit 12
MILEAGE VS. AGE WITHOUT OUTLIERS 13
DEPRECIATION 15
Box plot 1 with outliers 16
Box plot 1b without outliers 16
ANALYSIS 17
CORRELATIONS 17
Graph 1 17
Graph 1b 17
Graph 2 17
Graph 2b 17
OUTLIERS OBSERVATIONS 18
Observations between graph with outliers and without outliers 18
Formula of outliers 18
Cars being outliers 18
Identified outliers with reasons 18
Removal on outliers 19
EQUATION OF BEST FIT 19
HYPOTHESIS CONCLUSIONS 20
First hypothesis 20
Second hypothesis 20
Coursework Improvements 20
Introduction
In my coursework I have to investigate the influences in car prices of the second hand price samples I am taking. In the coursework you can choose 20 factors but I am going to choose only 2 because I consider that the 2 I am picking will affect the prices all second hand cars the most. The first factor I am going to select is age because I believe that age of a second hand car can affect the price because of how good the condition of the car has been in because when you have an car that is 10 years old it is most likely that it needs repairs and also having a 10 year old car the parts of the car will start to fail because it is old so the price is put lower as of the condition of the car, the second factor I have consider is mileage because I believe that mileage depending on how much a car has travelled can affect the condition of the used cars with its price because when the car has travelled over 50,000 miles the parts of the car will deteriorate because the car parts start to be worn out so I think that the more mileage done on the car the less the price is.
Sampling
Out of the 204 samples I have chosen 110 samples because I believe that it will give more evidence to my hypothesis because the more the amount of samples chosen the most likely that your results would be correct also with the more samples I have taken the results would be more accurate e.g. if I had chosen 50 cars which is not a wide range I would not get accurate results because it is an smaller number but 110 cars is more of a wide range of cars which I have more data to compare and find more accurate results. I had collected the data from 204 samples to 110 samples by using a calculator and typing in the following keys, which are, (Input 204 x Ran) this gave me random numbers, which I rounded the number to the nearest whole number if the number on the calculator had been to one decimal place e.g. 34.1 I rounded to the nearest whole number which is 34 which then I would highlight the 110 cars that are staying in the table from the 204 numbers until I had the size of the sample I required for my data.
Hypothesis
In my hypothesis I will explain the different hypothesis, which I will show at the conclusion if my hypothesis is correct.
First hypothesis
The first of my hypothesis is that I believe that the:
H0. Price of the car is not related to how old the car is in second hand cars.
H1. Alternative hypothesis is there is a negative correlation between age and price i.e. as the age of the car increases, the price of the car decreases.
I will test this hypothesis by drawing a scatter diagram of 'price now' against the 'age of the car', I will then obtain the line of best fit through points of prices against age and estimate from the equation able tremline of my scatter graph, which then I will make predications from the line of best fit, which I will then conclude the scatter graph and refer back to my predications.
Second hypothesis
The second of my hypothesis is that I believe that there is:
H0. No correlation between the price of cars and how far it has travelled in mileage.
H1. Alternative hypothesis is there is a negative correlation between price and mileage i.e. the most mileage a car has travelled the price of the car goes down.
I will test this hypothesis by drawing a scatter diagram of 'price now' against the 'mileage of the car', I will then obtain the line of best fit through points of prices against age and estimate from the equation able tremline of my scatter graph, which then I will make predications from the line of best fit, which I will then conclude the scatter graph and refer back to my predications.
Third hypothesis
The third of my hypothesis is that I believe that there is:
H0. The percentage rate of depreciation is constant from one year to the next.
H1. The rate of depreciation is more in the first year and then decreases year to year.
I will test this hypothesis by drawing a scatter diagram of 'age' against the 'depreciation of the car', I will then obtain the line of best fit through points of age against depreciation, which then I will make predications from the line of best fit, which I will then conclude the scatter graph and refer back to my predications.
Fourth hypothesis
The fourth of my hypothesis is that I believe that there is:
H0. There is no correlation between mileages vs. age
H1. There is a positive correlation between mileages vs. age.
I will test this hypothesis by drawing a scatter diagram of 'mileage' against the 'age', I will then obtain the line of best fit through points of mileage against age, which then I will make predications from the line of best fit, which I will then conclude the scatter graph and refer back to my predications.
Method on removing outliers
To remove my outliers of my second hand car I will use quartiles to find out the outliers of my second hand cars, which then I will remove, and any second hand cars over the greater than or less than outliers. I will first check before a calculate to see if there is any outliers by determining what type of distribution I have in my spreadsheet that I have created which I will see if it's a normal distribution, positive skew or a negative skew. I then will check the distribution and type in the greater than formula which is (Q3+1.5*IQR) this formula will tell me the greater outliers which then I will see if any cars go over the range of the greater than outliers which I will delete the car e.g. the greater than outlier is 400 and one off my cars is 500 I will delete that car because they are large values. Also for the negative skew I will type in the formula which is (Q3-1.5*IQR) this formula will tell me the less than outliers which I will see if any of my second hand price car is below that outlier and if a car is I will then delete the car from the spreadsheet e.g. the less than outlier is -1 and one of my cars is -2 I will delete the car because it is a small value.
Plan
In my coursework I want to see which factor affects the price of the car the most, which values its car at a lower price. Im first going to write up how hypothesis and list factors which I have chosen. Im then going to make scatter graphs with outliers and the same without outliers where I will compare the graphs with the outliers and without the outliers, which then Im going to show the line of best fit and show predictions from the line of best fit from the priced values given which are £6000, ...
This is a preview of the whole essay
Plan
In my coursework I want to see which factor affects the price of the car the most, which values its car at a lower price. Im first going to write up how hypothesis and list factors which I have chosen. Im then going to make scatter graphs with outliers and the same without outliers where I will compare the graphs with the outliers and without the outliers, which then Im going to show the line of best fit and show predictions from the line of best fit from the priced values given which are £6000, £4000, £2000 which then Im going to find out the predications from my line of best fit and make the predictions in the table, and the same of my equation of best fit where I will rearrange the numbers and interpret the equation. I will then comment on the graphs e.g. if it shows a negative correlation and relate it back to my hypothesis. Also Im going consider two factors for depreciation, to find out the depreciation of the age of the car and also the mileage of the car and make suitable predications from the curves of best fits without the outliers in my graphs, which I will put a table with price new by that price now then age which then I will do this formula = (price new -price now)/price new *100.I will also make a graph of mileage vs. age and conclude it and make predictions from the graph.
Graphs and analysis
Scatter diagrams
Scatter diagrams
The graphs here show scatter diagrams of price vs. ages and also price vs. mileage In the graph I have not removed the outliers at the amount because I feel if I do 2 separate graphs with one graph with outlier and the other with the removed outliers then I can observe the graph with the outliers and identify the outliers and compare the graphs with no outliers.
Prices vs. Age
Graph 1
Equation of line of best fit
Y = -1200x + 14000
The equation of best fit shows that 1 once every year has gone the price of the car decreases by 1200/per year.
From graph 1 we can see that there is a negative correlation between age and price when referring to second hand cars. This means that as the age of the car increases the price of the car has decreased. Based on this information shown on the graph I predict as the age of the car increases, the price of the car will decrease.
From the line of best fit I can predict the age of the car knowing its price, by drawing a line from the given price until it hits the line of best fit. This is method is shown on graph 1. Which then the results will be on the table below. Also the equation of best fit shows that the graph is a negative correlation because the first part of the correlation shows -1174.5 because there is a - there is a negative correlation.
Graph 1 also shows the equation of the line of best fit to be: Y = -1174.5x + 14088. From this equation we can predict the price of the car when knowing it's age and also predict the age of the car when knowing it's price, by rearranging the equation to make x the subject.
The following calculations have been done to work out the age of differently priced second hand cars:
Y = 6000
6000 = -1174.5 x +14088
6000-14088 =-1174.5x
X = 6000-14088
-1174.5
X=6.88633461
=7 (nearest year)
. Y = 4000
4000 = -1174.5 x +14088
4000-14088 =-1174.5x
X = 4000-14088
-1174.5
X=8.589186888
=9 (nearest year)
3. Y = 2000
2000 = -1174.5 x +14088
2000-14088 =-1174.5x
X = 2000-14088
-1174.5
X=10.29203917
=10 (nearest year)
Price £
Age predicted from line of best fit
Age predicted from equation for line of best fit
6000
6.5
7
4000
8.6
9
2000
0.2
0
Table of predicted age of car from the line of best fit
Prices vs. Age without outliers
Graph 1b
Equation of line of best fit
Y = -800x+10000
The equation of best fit shows that 1 once every year has gone the price of the car decreases by 800/per year.
From graph 1b we can see that the scatter of price vs. age is showing a negative correlation when we refer to the second hand cars. This means that when the age of the car increase in years the price of the car will decrease. Based on the information shown on graph 1b I predict as the age of the car increases by years, the price of the car will decrease because of the negative correlation, also the equation of best fit shows that the graph is a negative correlation because the first part of the correlation shows -776.66 because there is a - there is a negative correlation.
From the line of best fit shown in red, I can predict the age of the car knowing the price given, by drawing a line from the price given until it touches the line of best fit. The method is shown on graph 1b with coloured lines, which then the results will be on the table below.
Graph 1b also shows the equation of the line of best fit to be: Y = -776.66x + 10327.
From the equation we can make out the price of the car when knowing the age of the car and also predict the age of the car when knowing the price, by rearranging the equation to make X the subject in the equation
The following calculations have been done to work out the age of differently priced second hand cars:
. Y = 6000
6000 = 776.66x +10327
6000-10327 =-0.0054x
X = 6000-10327
776.66
X=5.571292457
X=6(to the nearest age in years)
2. Y = 4000
4000 = 776.66x +10327
4000-10327 =-0.0054x
X = 4000-10327
776.66
X=8.146421858
X=8(to the nearest age in years)
3. Y = 2000
2000 = 776.66x +10327
2000-10327 =-0.0054x
X = 2000-10327
776.66
X=10.72155126
X=11(the nearest age in years)
Table of predicted age of car from the line of best fit
Price £
Age predicted from line of best fit
Age predicted from equation for line of best fit
6000
5.5
6
4000
8.1
8
2000
0.1
1
Price vs. Mileage
Graph 2
Equation of line of best fit
Y = -0.1200x+14000
The equation of best fit shows that 1 once every mile has gone the price of the car decreases by 12/per mile.
From graph 2 we can see the data provided is randomly scattered as if there is no correlation between price and mileage. However the line of best fit shows that there is a negative correlation, meaning that as the mileage increases the price of the car also decreases. Based on the information shown on graph 2 I predict as the mileage of the car increases by miles, the price of the car will decrease because of the negative correlation, also the equation of best fit shows that the graph is a negative correlation because the first part of the correlation shows -0.1248 because there is a - there is a negative correlation.
From the line of best fit shown in red, I can predict the age of the car knowing the price given, by drawing a line from the price given until it touches the line of best fit. The method is shown on graph 2 with coloured lines, which then the results will be on the table below.
Graph 2 also shows the equation of the line of best fit to be: Y = -0.1248x + 14000
From the equation we can make out the price of the car when knowing the mileage of the car and also predict the mileage of the car when knowing the price, by rearranging the equation to make X the subject in the equation.
The following calculations have been done to work out the mileage of differently priced second hand cars:
. Y = 6000
6000 = -0.1248x +14000
6000-14000 =-0.1248x
X = 6000-14000
-0.1248
X=64102.5641
X=64103(to the nearest mile)
2. Y = 4000
4000 = -0.1248x +14000
4000-14000 =-0.1248x
X = 4000-14000
-0.1248
X=80128.20513
X=80128(to the nearest mile)
3. Y = 2000
2000 = -0.1248x +14000
2000-14000 =-0.1248x
X = 2000-14000
-0.1248
X=96153.84615
X=96154 (to the nearest mile)
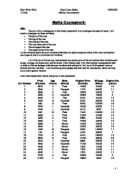
Table of predicted mileage of car from the line of best fit
Price £
Mileage predicted from line of best fit
Mileage predicted from equation of line of best fit
6000
64103
64000
4000
80128
80000
2000
96154
96000
Price vs. Mileage without outliers
Graph 2b
Equation of line of best fit
Y=-0.0755x+10000
The equation of best fit shows that 1 once every mile has gone the price of the car decreases by 8/per mile.
From graph 2b we can see the data provided is less randomly scattered than the scatters in graph 2 which shows outliers have been, the line of best fit shows that there is a negative correlation, this means that when the mileage of the car increases then the price of the car will decrease because of the negative correlation. Based on the information shown on graph 2b I predict as the car mileage increases by miles, the price of the car will decrease because of the negative correlation, also the equation of best fit shows that the graph is a negative correlation because the first part of the correlation shows -0.0755because there is a - which shows there is a negative correlation.
From the line of best fit shown in red, I can predict the age of the car knowing the price given, by drawing a line from the price given until it touches the line of best fit. The method is shown on graph 2b with coloured lines, which then the results will be on the table below.
Graph 2b also shows the equation of the line of best fit to be: Y = -0.0755x + 10000
From the equation we can make out the price of the car when knowing the mileage of the car and also predict the mileage of the car when knowing the price, by rearranging the equation to make X the subject in the equation.
The following calculations have been done to work out the mileage of differently priced second hand cars:
. Y = 6000
6000 = -0.0755x +10000
6000-10000 =-0.0755x
X = 6000-10000
-0.0.755
X=52980.13245
X=52980 (to the nearest mile)
2. Y = 4000
4000 = -0.0755x +10000
4000-10000 =-0.0755x
X = 4000-10000
-0.0.755
X=79470.19868
X=79470 (to the nearest mile)
3. Y = 2000
2000 = -0.0755x +10000
2000-10000 =-0.0755x
X = 2000-10000
-0.0.755
X=105960.2649
X=105960 (to the nearest mile)
Table of predicted mileage of car from the line of best fit
Price £
Mileage predicted from line of best fit
Mileage predicted from equation of line of best fit
6000
52980
57000
4000
79470
78000
2000
05960
03000
Mileage Vs. Age without outliers
Equation of line of best fit
Y =3661.8x + 10000
The equation of best fit shows that as the car gets 1 year older the car has done a mileage of 3661.8 miles.
From this graph we can see the data provided that all the scatter points are in a positive correlation as shown by the line of best fit 2, the line of best fit shows that there is a positive correlation, this means that the mileage of the car increases
As the age of the car increases because of the positive correlation. Based on the information shown on this I predict as the car mileage increases by miles, the age of the car would have increased because of the positive correlation, also the equation of best fit shows that the graph is a positive correlation because the first part of the correlation shows 3661 because there is no - it shows there is a positive correlation in the graph.
From the line of best fit shown in red, I can predict the mileage of the car knowing the age given, by drawing a line from the price given until it touches the line of best fit. The method is shown on this with coloured lines, which then the results will be on the table below.
This graph also shows the equation of the line of best fit to be: Y =3661.8x + 10000
From the equation we can make out the mileage of the car when knowing the age of the car and also predict the age of the car when knowing the age, by rearranging the equation to make X the subject in the equation.
The following calculations have been done to work out the age of differently priced second hand cars:
. Y = 20000
20000= 3661.8x+10000
20000 -10000 =3661.8x
X = 20000-10000
3661.8
X=2.73089737373
X=3 (to the nearest age)
2. Y = 30000
30000= 3661.8x+10000
30000 -10000 =3661.8x
X = 30000-10000
3661.8
X=5.461794746
X=5 (to the nearest age)
3. Y = 40000
40000= 3661.8x+10000
40000 -10000 =3661.8x
X = 40000-10000
3661.8
X=8.192692119
X=8 (to the nearest age)
Mileage miles)
Mileage predicted from line of best fit
Mileage predicted from equation of line of best fit
20000
3
3
30000
6
5
40000
8
8
Depreciation
This shows the depreciation of age, the curve of best shows the rate of depreciation is more in the first year and then decreases year to year i.e. as the car age gets older the cost gets lower and shows as the car gets older the percentage of the price decreases. In the graph it shows that a car in the later years of the car age it is better to by the car at the age of 3 years old because the car holds there price of 15% of there depreciation while the car of the age of years has a depreciation rate of 5% which means that it is easier to buy a car of the age of 3 because the car price is cheaper at 3 years of age than when you buy a car brand new e.g. if you buy a car new then the price of the car goes down by 15% in 3 years which is a 5% decrease every year and the age of 3 years old car to 8 years keeps it price to 5 more years by 10 % which is only 1% of the price of the car every year as the car gets older. Also when you by a car at 3 years old the car price stays constants by years go by which means its better to get a car at the age of 3 years than a price new car, and an 8-year-old car.
Depreciation predictions of curve of best fit
.Line on bottom=3 years of age 2.Line on bottom= 8 years of age
Line on side=75 % Line on side=80%
=45 =80
3 8
3 year old car=15% 8 year old car=10%
Box plot of coursework initial data
Box plot 1 with outliers
Box plot 1b without outliers
Analysis
Correlations
Positive correlation
Negative correlation
No correlation
The points of the scatter are close to the line of best fit. It has a Positive gradient.
The points of the scatter are close to the line of best fit. It has a Negative gradient.
There is no scatter pattern just scattered points
This shows that as one variable increases, the other increases.
This shows that as one variable increases, the other decreases.
This shows that there is no connection between the two
Graph 1
In graph 1 I can see a negative correlation from the line of best fit when referring to our second hand cars so this means that the point lie close to the straight line which had a negative gradient between price vs. age. Based on this correlation and graph I can evaluate that the age of the car affects the price of the car, which means when the age of the car increases the price of the car will decrease.
Graph 1b
In graph 1b I can see that the line of best fit shows a negative correlation and also the scatter points because the point lie close to the straight line which had a negative gradient between price vs. age. Based on this correlation and graph I can evaluate that the age of the car affects the price of the car, which means when the age of the car increases the price of the car will decrease.
Graph 2
In graph 2 I can see that the line of best fit and the scatter points shows a negative correlation because the points on the graph are close to the line of best fit at a negative gradient between Prices vs. Mileage. Based on the information found I evaluate that when the Mileage of the car increases the price of the car will decrease, which means the price of the car will be less money when there is more mileage.
Graph 2b
In graph 2b I can see that the line of best fit and the scatters on the graph shows a negative correlation because the scatters shows a pattern which is close to the line of best fit and shows an negative gradient. Based on this information I can evaluate when the Mileage of the car increases the price of the car will decrease, which means when there are more mileage on the car the price will be less when the price had been new.
Outliers observations
Observations between graph with outliers and without outliers
In my graph I had shown 4 graphs two of each graph had been the same but 1 of the two graphs I had without outliers e.g. price vs. age (with outliers) another graph price vs. mileage (without outliers). I had noticed that the graphs with outliers had a bigger scale because the cars which had been outliers was extreme values but the graphs without the outliers had been on a smaller scale because the cars with extreme outliers had been removed. I had also noticed that few of the scatters had been not close to the line of best fit which shows that they are outliers because they are further away form the line of best fit.
Formula of outliers
The method I had used for removing my outliers had been quartiles, I had first found out the greater than formula which is (Q3+1.5*IQR) this formula will tells me the greater outliers which then I look onto my spread sheet I had seen if any cars go over the range of the greater than outliers which I will delete the car e.g. the greater than outlier is 400 and one off my cars is 500 I deleted that car because they are large values. Also I had typed in the formula which is (Q3-1.5*IQR) this formula will tell me the less than outliers which I had seen if any of my second hand price car is below that outlier and if a car is I had then deleted the car from the spreadsheet e.g. the less than outlier is -1 and one of my cars is -2 I will delete the car because it is a small value. (See excel spreadsheet of outliers which are coloured in blue).
Greater than
43790
8173
8
32000
Less than
-9503
-7368
-5
-60000
Car No. Deletions
07, 90,166
66,151,122,107,104,30,10,8
None
None
Cars being outliers
The cars had been outliers (excel spreadsheet coloured in blue) because their price of the car had been extreme values which where either large or small e.g. the greater than outlier had been 43790 the car price had been 50000 so that is considered to be an outlier, which same applies to a smaller value. Also these cars disfigure the data sample and the mean value, which means it, could have given wrong data and would have not given fair and unbiased results. Some of the cars would have been outliers because they have invalid data, which shows on the spreadsheet that there is no price in the box, which is a blank sum, which cannot be used in the scatter diagram.
Identified outliers with reasons
I had identified my outliers by the graphs I had made without outliers because I had seen that some of the points had been to far away from the line of best fit which means that they are outliers because they are extreme values, when I had done the formula to remove the outliers I had noticed on my graph that all the points had been closer to the line of best fit than away from the line of best fit.
Removal on outliers
The removal of outliers had affected my line of best fit because they scatters that are shown of graph1 and graph 2 are further away from the line of best fit but the other graph 1b and graph 2b without the outliers show that all the scatters are closer to the graph because the outliers in graph 1 and graph 2 has extreme outliers which then makes the line of best fit less sharper for graph 1 and graph 2 because the line of best fit is trying to go in the middle on the higher value and the lower value which does not give a fair result, however in graph 1b and graph 2b the line of best fit shows a much sharper negative line because the line of best fit is in the middle of all the scatters which gives me a accurate and fair result.
Equation of best fit
The equation of best fit shows the equation of the line of best which means when you pick any value you can put it in the equation of best fit by rearranging the equation which it would show the precise value of what the value would be at that point e.g. you put in a price in the equation of best fit and you want to find out what would the mileage would be at that price when you rearrange the equation it will show the what the mileage would be at that price.
You can get the equation of best fit by making calculations from the line of best fit with using the scatter plots by using the formula y=mx+c for example:
Y
X
This shows the formula of how you can get the equation of best fit for the line of best fit and shows how the equation of best fit can be made from the scatter points and the line of best fit.
Hypothesis conclusions
First hypothesis
The first of my hypothesis is that I believe that H1 had been correct
. Price of the car is not related to how old the car is in second hand cars.
b) Alternative hypothesis is there is a negative correlation between age and price i.e. as the age of the car increases, the price of the car decreases.
I think that H1 had been correct because in the H1 it says b) Alternative hypothesis is there is a negative correlation between age and price i.e. as the age of the car increases, the price of the car decreases. Which means that there would be a negative correlation and when age increases price would decrease? I believe that H1 had been correct because referring back to graph 1b I can see that there is a negative correlation because there is a negative gradient and that would mean that when age increases price would decreases which is by hypotheses of H1.So I conclude that when the mileage of the car increases the price of the car decreases and if I had been buying a car it would be 3 years old with a mileage of 20000 miles because if a car is new you will have to get used to the car but when it is 3 years old everything about the car is good.
Second hypothesis
The second of my hypothesis is that I believe that there is H1 had been correct
2. No correlation between the price of cars and how far it has travelled in mileage.
b) Alternative hypothesis is there is a negative correlation between price and mileage i.e. the most mileage a car has travelled the price of the car goes down.
I think that H1 had been correct because in the H1 it says b) Alternative hypothesis is there is a negative correlation between price and mileage i.e. the most mileage a car has travelled the price of the car goes down. Which means that there would be a negative correlation and means that when mileage increase price would decrease; referring back to graph 2b it shows a negative correlation and means that when the mileage of the car increases the price of the car will decrease. I conclude that when the mileage of the car increases the price of the car will decrease.
Coursework Improvements
From my coursework I could improve it by including more factors so I can see what other factors affect the price and compare my results. I could also do Internet research so I can search on the cars and what affects the cars the most. I could also look in car magazines to find out more about what affects the price of the car. I could choose a bigger sample because the bigger the sample I have the more accurate my results would be and I would also get more evidence for my graphs and conclusions e.g. if I had 150 car samples I would be able to know more about what affects the price because it's a higher value.