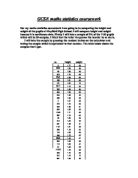
Maths Coursework. Statistics
Introduction
Aim:
To express evidence to support my hypothesis.
Proving my hypothesis
I will use:
> scatter diagram
> bar charts
> tables
> frequency table
What I will do:
> stratified sample
> random sample
> standard deviation
> Find the mean, mode, median to compare my first hypothesis.
To do these I will use a scientific calculator
Introduction:
Using the information given before me I have decided with three hypotheses that I shall investigate. These are:
. Females longer than males.
2. The richer the country the higher the average birth rate.
3. The higher the continents GDP-per capita (in my data) the greater it's highest average age.
For me to prove these hypotheses I will need to collect a sample of male ad females ages in addition to that I will also need to get a sample of money to do my second hypothesis, which is to compare both together. For this to be more accurate and for me to get enough information to compare I will need a big sample of countries, so I have chosen a sample of 50. to get my data for my hypotheses I used a scientific calculator to do a stratified sample and a random sample did a stratifies sample because it would tell me how many countries I should use from each continent (it would give me the same percentage for each continent as they all have different amount of counties.) the formula that I used on the calculator to get this information was:
Country = how many continents in the country × how much I need .
The number of continents in the world
Asia = 54/235 ×50 = 11.4893617 (12 rounded up)
Africa = 57/235 ×50 = 12.12765957 (12)
Europe = 48/235 ×50 =10.21276596 (10)
Oceania = 25/235 ×50 = 5.319148936 (5)
North America = 37/235 ×50 = 7.872340426 (8)
South America = 14/235 ×50 = 2.978723404 (3)
I numbered all the countries and then once again I used the scientific calculator to do a random sample on my continents to pick my countries (I did this so all the countries will have the same chance of getting picked.) the formula that I used was:
(Shift) ran#× the amount appropriate.
E.g. to get a number in-between 0-90 I will input in the calculator:
(Shift) ran#× 90
If the same number comes up twice or more I will ignore it and carry on as I will have already highlighted that country to be part of my data. The data that I will use is called 'secondary' as I did not go and find it out myself.
Plan:
I will now find the highest and lowest life expectancy from my data that I chose by using random sampling. I will also show the highest average age and lowest average age in each continent.
I have done frequency tables to get the mean, mode and median for the females and the males so it will be a lot easier to compare.
My data that I used
North America
Countries
Male
Female
Money
Barbados
69.51
73.81
$15,700
Cayman Island
77.21
82.45
$35,000
Guatemala
64.30
66.13
$04,100
Haiti
50.52
53.12
$01,600
Honduras
64.99
67.37
$02,600
Nicaragua
67.99
72.16
$02,300
Saint Lucia
69.78
77.16
$05,400
United States
75.84
80.83
$37,800
Total
540.14
£ 573.03
$104,500
Europe
Countries
Male
Female
Money
Austria
76
81.89
$30,000
Czech republic
77.52
79.24
$15,700
France
75.80
83.27
$27,600
Liechtenstein
75.80
83.02
$25,000
Macedonia
72.45
77.20
$06,700
Malta
76.51
80.98
$17,700
Moldova
60.88
69.39
$01,800
Romania
67.63
73.27
$07,000
San Marino
78.02
85.34
$34,600
Sweden
78.12
82.62
$26,800
Total
$739
796.22
$192,900
South. America
Countries
Male
Female
Money
Argentina
71.95
79.65
$11,200
Chile
73.09
79.82
$9,900
Paraguay
72.12
77.29
$4,700
Total:
217.16
236.76
$25,800
Oceania
Countries
Male
Female
Money
Guam
75.08
81.34
$21,000
Palau
66.67
73.15
$9,000
Samoa
67.64
73.33
$5,600
Tuvalu
65.47
69.96
$1,100
Vanuatu
60.64
63.63
$2,900
Total:
335.5
361.41
$39,600
Africa
Countries
Male
Female
Money
Burkina Faso
42.62
45.83
$1,100
Burundi
42.73
44.00
$0,600
Central African Rep
39.70
43.08
$1,100
Congo Democratic Rep Of The
47.06
51.28
$0,700
Egypt
68.22
73.31
$4,000
Gambia ...
This is a preview of the whole essay
Palau
66.67
73.15
$9,000
Samoa
67.64
73.33
$5,600
Tuvalu
65.47
69.96
$1,100
Vanuatu
60.64
63.63
$2,900
Total:
335.5
361.41
$39,600
Africa
Countries
Male
Female
Money
Burkina Faso
42.62
45.83
$1,100
Burundi
42.73
44.00
$0,600
Central African Rep
39.70
43.08
$1,100
Congo Democratic Rep Of The
47.06
51.28
$0,700
Egypt
68.22
73.31
$4,000
Gambia the
52.76
56.87
$1,700
Ghana
55.36
57.22
$2,200
Nigeria
50.35
50.63
$0,900
Sao Tome and Princip
65.11
68.21
$1,200
Somalia
46.02
49.46
$0,500
Swaziland
39.10
35.94
$4,900
Zambia
35.19
35.17
$0,800
Total:
584.22
611
$19,700
Asia
Countries
Male
Female
Money
Afghanistan
42.27
42.66
$00,700
Burma
54.22
27.9
$01,800
Cyprus
75.11
79.92
$24,800
India
63.25
64.77
$02,900
Iraq
67.09
69.48
$01,500
Korea south
71.96
79.54
$17,900
oman
70.66
75.16
$13,100
Nepal
59.73
59.06
$01,400
Pakistan
61.69
63.58
$02,100
Philippines
66.74
72.61
$04,600
Singapore
78.96
84.29
$23,700
Vietnam
67.86
73.02
$02,500
Total:
779.54
791.99
$97,000
My first hypothesis: 'Females longer than males.'
Africa male
Highest average age: 68.22(68)
Lowest average age: 35.19(35)
Life expectancy
(years)
Frequency
(f)
Mid-point
(x)
(fx)
Fx2
Frequency density
35 › 45
5
40
200
8,000
0.5
45 › 55
5
50
250
12,500
0.5
55 › 65
60
60
3,600
0.1
65 › 75
70
70
4,900
0.1
Total:
2
580
29,000
Mean: ?fx = 580/12=48.3
? f
Mode: 35 › 45 and 45 › 55
Median: 45 › 55
Standard deviation: 9.15 (to 2 d.p.)
Africa female
Highest average age: 73.31(73)
Lowest average age: 35.17(35)
Life expectancy
(years)
Frequency
(f)
Mid-point
(x)
(fx)
Fx2
Frequency density
35 › 45
4
40
60
6,400
0.4
45 › 55
4
50
200
0,000
0.4
55 › 65
2
60
20
7,200
0.2
65 › 75
2
70
40
9,800
0.2
Total:
2
620
33400
Mean: ?fx =620/12=51.7
? f
Mode: 35 › 45 and 45 › 55
Median: 45 › 55
Standard deviation: 10.51 (to 2 d.p)
Asia male
Highest average age: 78.96(79)
Lowest average age: 42.27(42)
Life expectancy
(years)
Frequency
(f)
Mid-point
(x)
(fx)
Fx2
Frequency density
25 › 35
0
30
0
0
0
35 › 45
40
40
,600
0.1
45 › 55
50
50
2,500
0.1
55 › 65
3
60
80
0,800
0.3
65 › 75
5
70
350
24,500
0.5
75 › 85
2
80
60
2,800
0.2
Total:
2
780
52,200
Mean: ?fx =780/12=65
? f
Mode: 65 › 75
Median: 65 › 75
Standard deviation: 11.18 (2 d.p.)
Asia female
Highest average age: 84.29(84)
Lowest average age: 27.9(28)
Life expectancy
(years)
Frequency
(f)
Mid-point
(x)
(fx)
Fx2
Frequency density
25 › 35
30
30
900
0.1
35 › 45
40
40
,600
0.1
45 › 55
0
50
0
0
0
55 › 65
4
60
240
4,400
0.4
65 › 75
2
70
40
9,800
0.2
75 › 85
4
80
320
25,600
0.4
Total:
2
770
52,300
Mean ?fx =770/12=64.2
? f
Mode: 75 › 85 and 55 › 65
Median: 55 › 65
Standard deviation: 15.38 (2 d.p.)
Oceania male
Highest average age: 75.08(75)
Lowest average age: 60.64(61)
Life expectancy
(years)
Frequency
(f)
Mid-point
(x)
(fx)
Fx2
Frequency density
35 › 45
0
40
0
0
0
45 › 55
0
50
0
0
0
55 › 65
2
60
20
7,200
0.2
65 › 75
3
70
210
4,700
0.2
Total:
5
330
21900
Mean: ?fx = 330/5=66
? f
Mode: 65 › 75
Median: 65 › 75
Standard deviation: 4.91 (2 d.p.)
Oceania Female:
Highest average age: 81.34(81)
Lowest average age: 63.63(64)
Life expectancy
(years)
Frequency
(f)
Mid-point
(x)
(fx)
Fx2
Frequency density
35 › 45
0
40
0
0
0
45 › 55
0
50
0
0
0
55 › 65
60
60
3600
0.1
65 › 85
4
75
300
22,500
0.2
Total:
5
360
26100
Mean: ?fx = 360/5=72
? f
Mode: 65 › 85
Median: 65 › 85
Standard deviation: 6
South America male
Highest average age: 73.09(73)
Lowest average age: 71.95 (72)
Life expectancy
(years)
Frequency
(f)
Mid-point
(x)
(fx)
Fx2
Frequency density
35 › 45
0
40
0
0
0
45 › 55
0
50
0
0
0
55 › 65
0
60
0
0
0
65 › 85
3
75
225
6,875
0.15
Total:
3
225
6,875
Mean: ?fx 225/3=75
? f
Mode: 65 › 85:
Median: 65 › 85
Standard deviation: 0
South America female
Highest average age: 79.82(80)
Lowest average age: 77.29 (77)
Life expectancy
(years)
Frequency
(f)
Mid-point
(x)
(fx)
Fx2
Frequency density
35 › 45
0
40
0
0
0
45 › 55
0
50
0
0
0
55 › 65
0
60
0
0
0
65 › 85
3
75
225
6,875
0.15
Total:
3
225
6,875
Mean: ?fx = 225/3=75
? f
Mode: 65 › 85
Median: 65 › 85
Standard deviation: 0
North America male
Highest average age: 77.21(77)
Lowest average age: 50.52 (51)
Life expectancy
(years)
Frequency
(f)
Mid-point
(x)
(fx)
Fx2
Frequency density
35 › 45
0
40
0
0
0
45 › 55
50
50
2500
0.1
55 › 65
2
60
20
7200
0.2
65 › 75
5
70
350
24,500
0.5
Total:
8
520
34,200
Mean: ?fx =520/8=65
? f
Mode: 65 › 75
Median: 65 › 75
Standard deviation: 7.07 (2 d.p.)
North America female
Highest average age: 82.45(83)
Lowest average age: 53.12(53)
Life expectancy
(years)
Frequency
(f)
Mid-point
(x)
(fx)
Fx2
Frequency density
35 › 45
0
40
0
0
0
45 › 55
50
50
2500
0.1
55 › 65
0
60
60
0
0
65 › 75
7
70
490
34,300
0.7
Total:
8
600
36,800
Mean: ?fx =600/8=75
? f
Mode: 65 › 75
Median: 65 › 75
Standard deviation: 3.20 (2.d.p.)
Europe male
Highest average age: 78.12(78)
Lowest average age: 60.88(61)
Life expectancy
(years)
Frequency
(f)
Mid-point
(x)
(fx)
Fx2
Frequency density
35 › 45
0
40
0
0
0
45 › 55
0
50
0
0
0
55 › 65
60
60
3600
0.1
65 › 75
9
70
630
44,100
0.9
Total:
0
690
47,700
Mean: ?fx = 690/10= 69
? f
Mode: 65 › 75
Median: 65 › 75
Standard deviation: 3
Europe female
Highest average age: 85.34(85)
Lowest average age: 69.39(69)
Life expectancy
(years)
Frequency
(f)
Mid-point
(x)
(fx)
Fx2
Frequency density
35 › 45
0
40
0
0
0
45 › 55
0
50
0
0
0
55 › 65
0
60
0
0
0
65 › 75
0
70
700
49,000
Total:
0
700
49,000
Mean: ?fx = 700/10 = 70
? f
Mode: 65 < x ? 75
Median: 65 › 75
Standard deviation: 0
I have noticed that when I did the mode and median they are mostly the same for both male and female. The mean is mostly higher in females as my hypothesis, but in Asia it is the other way round .I believe this is because they have less money even though it has a lot of countries. In South America the mean is the same for males and females. I suppose this is because it has the least money and they have the least countries in my data. I consider that if I had used more countries I would have had a more spread out data. (e.g.70.)
My second hypothesis: 'The richer the country the higher the average birth rate.'
For my second hypothesis I have done two different graphs one which is for the males and females average age and the second one is for the GDP per capita (money).
These graphs show us that mostly females live longer than males in Asia .it also links in with the second graphs and shows us that the higher the GDP the higher the age.
Asia:
In Burma and Nepal my first hypothesis is wrong but my second one is right because the male's average age is higher than the female's average age on the other hand the GDP is low so is the average age.
countries
male
female
money
Afghanistan
42.27
42.66
$700
Burma
54.22
27.9
$1,800
Cyprus
75.11
79.92
$24,800
India
63.25
64.77
$2,900
Iraq
67.09
69.48
$1,500
Korea south
71.96
79.54
$17,900
Oman
70.66
75.16
$13,100
Nepal
59.73
59.06
$1,400
Pakistan
61.69
63.58
$2,100
Philippines
66.74
72.61
$4,600
Singapore
78.96
84.29
$23,700
Vietnam
67.86
73.02
$2,500
North America:
In this graph it proves that my hypothesis are correct it also proves that the higher the GDP the higher the average age.
countries
male
female
money
Barbados
69.51
73.81
$15,700
Cayman Island
77.21
82.45
$35,000
Guatemala
64.3
66.13
$4,100
Haiti
50.52
53.12
$1,600
Honduras
64.99
67.37
$2,600
Nicaragua
67.99
72.16
$2,300
Saint Lucia
69.78
77.16
$5,400
United States
75.84
80.83
$37,800
Europe:
This graph shows us that the higher the GDP, therefore the higher the average age for males and female. This shows us that females live longer than males.
countries
male
female
money
Austria
76
81.89
$30,000
Czech republic
77.52
79.24
$15,700
France
75.8
83.27
$27,600
Liechtenstein
75.8
83.02
$25,000
Macedonia
72.45
77.2
$6,700
Malta
76.51
80.98
$17,700
Moldova
60.88
69.39
$1,800
Romania
67.63
73.27
$7,000
San Marino
78.02
85.34
$34,600
Sweden
78.12
82.62
$26,800
South America
These graphs are showing a comparison that females live longer than males it is also showing that the higher the G.D.P the longer the life expectancy. These graphs give a very clear view on this. They both show that my hypotheses are true.
countries
male
female
money
Argentina
71.95
79.65
$11,200
Chile
73.09
79.82
$9,900
Paraguay
72.12
77.29
$4,700
Oceania:
These graphs are showing a comparison that females live longer than males it is also showing that the higher the G.D.P the longer the life expectancy The graph on females live longer than males show that my first hypothesis is correct but the other graph shows that my second hypothesis is not always correct.
countries
male
female
money
Guam
75.08
81.34
$21,000
Palau
66.67
73.15
$9,000
Samoa
67.64
73.33
$5,600
Tuvalu
65.47
69.96
$1,100
Vanuatu
60.64
63.63
$2,900
Africa:
These graphs also show that my hypothesis cannot always be correct. In Burundi, Ghana, Swaziland, Zambia average age is not always higher than the male's average age, also my second hypothesis is proven not to be always correct as it shows in Swaziland the average age is low and the GDP per capita is high.
countries
male
female
money
Burkina Faso
42.62
45.83
$1,100
Burundi
42.73
44
$600
Central African Rep
39.7
43.08
$1,100
Congo Democratic Rep Of The
47.06
51.28
$700
Egypt
68.22
73.31
$4,000
Gambia the
52.76
56.87
$1,700
Ghana
55.36
57.22
$2,200
Nigeria
50.35
50.63
$900
Sao Tome and Princip
65.11
68.21
$1,200
Somalia
46.02
49.46
$500
Swaziland
39.1
35.94
$4,900
Third hypothesis: 'The higher the continents GDP-per capita (in my data) the greater it's highest average age.'
North America:
Total amount of money in continent.
Highest average age in the continent of males
Highest average age in the continent of females
$104,500
77.21(77)
82.45(83)
South America:
Total amount of money in continent.
Highest average age in the continent of males
Highest average age in the continent of females
$25,800
73.09(73)
79.82(80)
Europe:
Total amount of money in continent.
Highest average age in the continent of males
Highest average age in the continent of females
$192,900
78.12(78)
85.34(85)
Asia:
Total amount of money in continent.
Highest average age in the continent of males
Highest average age in the continent of females
$97,000
78.96(79)
84.29(84)
Africa:
Total amount of money in continent.
Highest average age in the continent of males
Highest average age in the continent of females
$19,700
68.22(68)
73.31(73)
Oceania:
Total amount of money in continent.
Highest average age in the continent of males
Highest average age in the continent of females
$39,600
75.08(75)
81.34(81)
In these tables I have shown here that the higher the GDP per capita (money) the higher the highest average age in my data.
For example from all those tables the continent with the lowest total amount of GDP per capita is Africa:
Total of money is 19,700
Highest average age for males is: 68.22(68)
Highest average age for females is: 73.31(73)
The continent with the highest total amount of GDP per capita is Europe:
Total of money is: 192,900
Highest average age for males is: 78.12(78)
Highest average age for females is: 85.34(85)
This here has shown that the country with the highest total amount of money (in my data) has the higher average ages for males and females. This links in with my second hypothesis 'The richer the country the higher the average birth rate.' This links in because they are quite familiar the difference is that this is the total and my second hypothesis was the actual one to one results to compare and to get the results that I needed for my third hypothesis. This hypothesis is also linked in with the first as I got the highest average rate from my first hypothesis.
Conclusion:
The data that has been collected has made me come to a conclusion that females live longer than males I have also noticed from this that this is not the case for all the continents especially in Asia. This gave me a good reason to argue that in all the countries it is not always 'females live longer than males', and also that the GDP has no link with the average age in some countries
The way I have shown my first hypothesis is by comparing the data using a frequency table from, which I was able to calculate the mean, mode and median and also the standard deviation so that I can show the difference figure that they represent between both the male and female from, which It can easily be concluded that my hypothesis is correct.
I have also shown as my second hypothesis that 'the higher the G.D.P the longer the life expectancy.' I have shown this with three different sets of data, one for males, one for females and the other one for the G.D.P. I have done different graphs to compare the data and get an actual result to prove that my hypothesis is correct.
I have also put a table to show my actual data that I had used to develop the graphs. I have highlighted the countries on the tables to show, which countries data did not confirm my hypothesis. I have done this for each continent to show the differences. I have also done each continent so I could get a more varied result to actually see if my hypothesis is true on all the continents. By doing this I have found out that not all the countries in different continents have a high G.D.P and a longer life expectancy.
Finally for my third hypothesis I have shown that the higher the continents GDP-per capita (in my data) the greater it's highest average age. I used a table to compare the data to get the result that my hypothesis was correct.
Overall I thought that the amount of data I used was enough to clearly interpret my data and come out with a final conclusion, which was that in most countries females live longer than males and also that the G.D.P had no effect on the age because in some countries the G.D.P was low and the age was high or in some it was that the G.D.P was high and the age was low. For example in Swaziland the G.D.P was high and the average life expectancy was low and also in Somalia the G.D.P was low and the average life expectancy was high. From my third hypothesis I found out that the higher the total amount of money in the whole continent the higher the average life expectancy.