I am now going to explain how I had worked out % price drop in price
The formula is
%Price Drop = Price When New – 2nd Hand Price x 100
Price When New
Now I am going to choose 1 car from the table and show how I done it
The formula is
% Price Drop in = Price When New- 2nd Hand Price x 100
Price When New
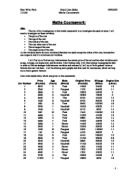
I have selected a car from the table to show how I have worked out the % price drop
% Price Drop in = 8601 - 3995 x 100
8601
=0.53x100
=53
Now I am going to present my data using a scatter graph. The scatter graph would show if the factors would have a correct data or not.
Looking at my graph I can see it is a positive correlation. This correlation is a week correlation, it is scatter around. This is because the different factors such as the age of the car might have affected the price of the car.
Observing my graph I now can predict the line of best fit would work. For example if someone comes with a car with 60,000 mileage the line of best would show us the price drop in price which is 86%
Now I am going to start off second part of my coursework. My hypothesis was, the higher the mileage the higher the price drop.
After completing my graph I could tell from the graph that the hypothesis was not unaffected. There might be other factors that might be affected such as the age of the car or the make of the car.
I am now going to start my second part of my investigation. I am going to investigate how the top brands such as BMW/Mercedes makes and ordinary cars such as Ford cars and to investigate which make would have a bigger percentage drop.
PREDICTION
I predict that Mercedes cars would have low in price then a Ford car. This is because Mercedes are a well known brand and are for wealthy people to buy.
HYPOTHESIS
The more prestigious the car the less in price drop then an ordinary car like ford. This is because Mercedes are top brand cars which are for wealthy people.
PLANNING
- I am going to collect 15 prestigious cars such as Mercedes, Bentley, Lexus, Audi, Rolls Royce and BMW. But there were only 10 prestigious cars in the table so I decided to put Volkswagen as a prestigious car because there were not enough prestigious cars, the reason for me to choose Volkswagen was that the price when new was higher then any other ordinary car.
- Then I am going to collect 15 ordinary cars such as:
Vauxhall, Renault, Rover, Fiat, Nissan & Toyota
- Then I am going to collect my data and plot it in a table
- Finally I am going to present my data on a box and whisker diagram
Prestigious Cars
Ordinary Cars