The information that I will need to collect to find out if my Hypothesis is right or wrong:
- Make of the car so Mercedes, BMW or Ford
- The ‘Used Price,’ of the car
- The ‘Mileage,’ of the car
I can find this information from a database which is a Secondary data Source, as the information in the database is from Nower Hill High School. The Pros and Cons of using a secondary database are:
Pros:
- The data is there for you, so you don’t need to spend time and collect the data.
- Also the data was easy to get
Cons:
- The data may be too old and not reliable enough
- Also the information could be miss typed or wrong, therefore making it unreliable.
Knowing that the data may be unreliable but because it would spare me time it would be a risk that would be taken. I know that the data would be most probably reliable because one person collected it and even though they could be mistakes it saves me time.
I will use a sample size of fifteen Mercedes, fifteen Fords and fifteen BMW.
This will be a fair sample because I will pick each one at random so that the test will be fair enough, and in contrast I pick them myself they won’t be fair as I might pick more expensive Mercedes and less expensive BMW and therefore I won’t get the right results and therefore my hypothesis won’t really get proven right or wrong. I will do this by pressing the random button on the calculator giving me a random number.
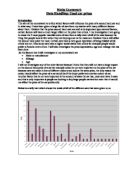
I will use the data to compare all the cars and I will use a scatter graph to compare each one to work out my hypothesis and whether it is right or wrong. I will also use a line of best fit. The reasons to why I have chosen this particular things Is because they will make it easy for me to present my data and also compare it.
The calculations that I am going to follow is that I am going to find the mean of each of the cars, and how I will be doing this is by adding al the prices say for example of the Mercedes and then diving it by fifteen and that would get me the mean, I will repeat it for the other columns and for each car, this is important because we are finding the average and that would give a rough idea of the results.
I will show the information in the following types of diagrams; I will use a table to show my data, then I will apply the data into a scatter diagram showing the different data of each make of cars, and I will compare It to see a difference between the cars and mileage and also used price. I will also have the line of best fit to help me maybe predict future points and also see the difference easily.
The diagrams will be useful because they let me predict future results and also help me set out my data easily, and this will be useful because I can see my data easily but also I can see there is a difference in them and they will be easily to compare to.
The results of the calculations will help me compare the Mercedes to the BMW and Ford and also I hope that when I display them I can predict future results but also compare the results to find a viable conclusion.