Boys= 28 +22 = 50 Girls= 26 + 24 = 50
These are the students I selected using the random number generator button on my calculator. (The students are represented by the number I issued them with when I was calculating the number of students in the spreadsheet):
Richard Tandy
Richard Tandy
Richard Tandy
Results: comparison of the Standard Deviation for boys and girls
The results for my Standard Deviation equations illustrate that, as I predicted, the Standard Deviation for girls (9.21) is smaller than the Standard Deviation for boys (10.24). Therefore, these calculations in some ways agree with my hypothesis: girls are more intelligent than boys because the IQ of the students who are girls are closer together, more consistent and more in line with the average. Where, on the other hand the standard Deviation equation tells me that the IQ of the students who are boys are less in line with the average and more spread out.
Cumulative Frequency and Box and Whisker diagrams
For these calculations I m going to estimate the median, the lower and upper quartiles, the inter-quartile range and how spread out the data values are. I have chosen this calculation because all of the things just mentioned will give me a good insight into whether my hypothesis is correct, whether girls are more intelligent than boys. Based on my hypothesis I expect that the data provided by these calculations will be in favour of the girls. For example, I believe the girls will probably have a higher median, higher upper and lower quartiles, a smaller inter-quartile range and a “tighter” distribution. I will go into this further in my Written Analysis.
The tables for the cumulative frequency curves are on the next two pages.
Richard Tandy
Data Sample Table Information.
- The information in the table is what I am going to use in my calculations. The calculations I am going to use in this coursework are: the standard deviation, cumulative frequency curves with accompanying box and whisker diagrams and finding out the averages of the data. These calculations will be used to answer and question my proposed hypothesis; ‘Girls are more intelligent than boys’.
- There are no anomalous results in the data (i.e. an IQ below 70) therefore I do not need to make any alterations. However, any anomalous results would have been removed from the data and replaced using the random sample procedure, as before, in order to make my calculations reliable.
- Throughout the course of my calculations I will explain what calculation I am going to do, why I have chosen the particular calculation and what I expect to happen. I will then shortly summerise the results of each calculation when completed, however, I will explain my results fully in my written analysis.
Averages
For my first calculations I am going to work out the average IQ for each gender. I will work out the average (mean) calculation as part of my standard deviation calculation, however, I also want to work out the calculation separately as I think it is a significant calculation. I have chosen this calculation because it will tell me the average IQ for both boys and girls; this will be quite significant data. Based upon my hypothesis: girls are more intelligent than boys, I expect that the average IQ for girls may be slightly higher than the average IQ for boys.
Results: comparison of the cumulative frequency curves and Box and Whisker diagrams showing the IQ of boys and girls
The results from my cumulative frequency graphs in some ways prove my hypothesis right but in other ways prove it wrong. For example, as shown in the box and whisker diagrams I was right when I said the inter-quartile range for girls would be smaller. Also, the lower quartile for the IQ of the girls is higher than the lower quartile of the IQ of the boys. Furthermore, the cumulative frequency curve for girls has a “tighter” distribution than that for boys, which means very constant results-I will explain this in my written analysis. However, my calculations show that the median for the boys is slightly higher than that for the girls and the upper quartile for the boys was higher than the upper quartile for the girls.
Written Analysis
- My calculations throughout this coursework illustrate that there is very little to chose between who is more intelligent-boys or girls. However, over all after closely analysing the calculations in this coursework, I believe that my hypothesis: girls are more intelligent than boys, is proven to be true. I will now analyze my calculations in the same chronological order that they were undertaken.
Firstly, my averages (mean) calculations did not did not answer my hypothesis girls are more intelligent than boys because the average IQ for the girls and boys in my data turned out to be exactly the same-the boys and girls both had an average IQ of 101. This was not much use to me, as it did not tell me which gender had the higher average IQ, however, it did provide me with a benchmark in which to further base my findings on.
My second calculations were the Standard Deviation calculations, which told me how close together the IQ’s of the students in each gender were. My Standard Deviation calculations clearly told me that, as I predicted, the Standard Deviation for girls (9.21) is smaller than the Standard Deviation for boys (10.24). Therefore, these calculations in some ways agree with my hypothesis: girls are more intelligent than boys, because the IQ of the students who are girls are closer together, more consistent and more in line with the average. Where, on the other hand the Standard Deviation equation tells me that the IQ of the students who are boys are less in line with the average and more spread out.
My final, and probably deciding calculations were my Cumulative Frequency graphs and Box and Whisker diagrams. There were also mixed results from these calculations, however, I believe they overall agreed with my hypothesis: girls are more intelligent than boys. Firstly, some of the information was in favour of the boys and in turn disagreed with my hypothesis. For example, my calculations show that the median for the boys (101) is slightly higher than that for the girls (100) and the upper quartile for the boys (105) was higher than the upper quartile for the girls (101). However, what I believe to be the most important information agreed with my hypothesis: girls are more intelligent than boys. For example, as shown in the box and whisker diagrams, the inter-quartile range for girls (3) is much smaller than that for the boys (11). This tells me that there is a smaller difference between the lower and upper quartiles for the girls and this coincides with the closer results for the girls than the boys from the Standard Deviation calculations. Also, the lower quartile for the IQ of the girls (98) is higher than the lower quartile of the IQ of the boys (94). This tells me that the boys with the lowest IQ’s had IQ’s lower than the girls who had the lowest IQ’s. Finally, as illustrated by the graph comparing the two cumulative frequency curves and box and whisker diagrams, the cumulative frequency curve for the girls has a much “tighter” distribution around the median and the box and whisker diagram is much smaller than that for the boys. On the other hand, the cumulative frequency curve for the boys is more widely spread and, as illustrated by the Box and whisker diagram, has a larger Inter-Quartile range. This means that the girls have more constant results and this coincides with my Standard Deviation equation and agrees with my hypothesis. For example, a “tighter” distribution represents very constant results e.g. lifetimes of batteries or light bulbs all very close to the median indicate a better product, compared to other distributions where the lifetimes show a wide variation albeit with the same median. This is the same scenario with the IQ’s of the boys and the girls-the girls have more constant results which are based around a similar average IQ compared with that of the boys.
- I did discover some limitations to the techniques I used for example, with my averages calculations the average IQ for boys and girls turned out to be exactly the same: 101 (rounded up from 100.9). This was because with the type of grouped frequency table I used you can only estimate the average and it was by chance that the results came out the same. – the tables I used did not contain the exact original values; therefore, they are probably not exact representations of the data.
Results: Comparison of the average IQ of the boys and girls
Strangely enough, the results from my frequency tables illustrate that from the information provided, the average IQ for boys and girls is exactly the same: 101 (rounded up from 100.9). These results tell me the average IQ for boys and girls, however, they are not much use to me, as they do not tell me which gender is more intelligent. Also, in this case, these calculations disagree with my hypothesis: girls are more intelligent than boys, as these results indicate than the average IQ for boys and girls is exactly the same. Then again, these results are only estimates because you can only estimate the average (mean) with this type of grouped frequency table – these tables do not contain the exact original values, therefore, they are probably not exact representations of the data.
Standard Deviation
For my next calculations I am going to work out the standard deviation of each gender. I have chosen this calculation because it will tell me how far apart the IQ of the students in each gender is. This will be important as it will tell me if the group has a wide range of IQ or not and this will be important when taking into account the average IQ of each gender (101) as it will tell me which gender has the more consistent results. Based upon my hypothesis: girls are more intelligent than boys, I expect that the standard deviation for girls will be smaller than the standard deviation for boys.
Richard Tandy
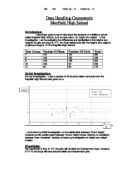
Tally Charts showing the data for the cumulative frequency diagrams, which will compare Year 10 and 11 Boy’s and Girl’s IQ.
Year 10 and 11 Girls.
X (IQ) Tally Frequency Cumulative Frequency
71 – 80 l 1 1
81 – 90 lll 3 4
91 – 100 llll llll llll
llll l 21 25
101 – 110 llll llll llll
llll 20 45
111 – 120 lll 3 48
121 – 130 ll 2 50
Year 10 and 11 Boys.
X (IQ) Tally Frequency Cumulative Frequency
81 – 90 llll llll 9 9
91 – 100 llll llll lll 13 22
101 – 110 llll llll llll 22 44
llll ll
111 – 120 llll 5 49
121 – 130 0 49
131 – 140 l 1 50
The information in these tables is what I am going to use in which to plot my cumulative frequency diagrams.