Hypothesis: The number of mistakes a candidate makes during their driving test is affected by the number of one hour lessons that they have had.”
I will need to do a stratified sample to see whether or not the number of one hour lessons affects the number of mistakes. I am only doing a sample of 100 as it will be too time consuming to do all the population. This is because I need to take a fairly large portion of the population in order to get an accurate representation, in case I coincidentally choose a section of the data that has a particularly strong or weak relationship. Also by using a stratified sample it will ensure that the data will be proportional. This will mean that none of the instructors will be either underestimated or overestimated and this will make it fairer. The sample number that I have chosen to do is 100, because it is a suitable amount of data to test. In order to get the correct samples from each instructor I will need to do the calculation:
The number of candidates for each instructor ÷ the total number of candidates × 100
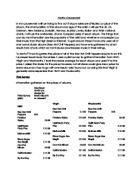
- Total number of candidates for all the instructors was 227.
- Total number of candidates for A was 60
- Total number of candidates for B was 93
- Total number of candidates for C was 24
- Total number of candidates for D was 50
-
Instructor A) 60/ 227 * 100 = 26.431718
There will be 26 samples from A
-
Instructor B) 93/227 * 100 = 40.969163
There will be 41 samples from B
-
Instructor C) 24/227 * 100 = 10.572687
There will be 11 samples from C
-
Instructor D) 50/227 * 100 = 22.026432
There will be 22 samples from D
After making the stratified sample I used the random number key generator on the calculator to choose the sample data from the data on the spreadsheet. This method makes the number of people sampled unbiased and fair. I will key in the random number generator and multiply this number by 226 as there are 227 people in the database. They data must be numbered from 0 to 226 so that when the numbers are generated from the calculator, the highest and lowest values have the same chance and be fair. I also made two separate stem and leaf diagrams for the number of lessons taken from the stratified sample and the number of minor mistakes made from the stratified sample.
Number of lessons
KEY
- The range of the number of minor mistakes was 35, and this shows that the results are varied and would’ve depended on more than one factor.
- The average was 25.29, which shows that the average amount of mistakes made was 25 and therefore could’ve been achieved easily.
I did these stem and leaf diagrams as it was the easiest way to order the data and look at it separately, before I made any conclusions about the number of lessons and number of mistakes relationship.
Below is the graph of the results found from the sample: y=-0.3468x+22.97
- I put a line of best fit in as some of the results looked like they followed a trend and also I wanted to check if the sample followed the hypothesis.
- The gradient of the line of best fit was -0.3468 which shows that as you have one lesson your number of mistakes decreases by 0.3468. And since the relationship of the line isn’t perfect this means that there are people who do not follow the trend.
- The y-intercept is 22.97 which tell us that when you have no lessons you will make 22.97 mistakes. This is incorrect as you wouldn’t take your driving test if you didn’t take any lessons.
- The correlation co-efficient is -0.3538 which is negative and moderately weak correlation. This weak correlation doesn’t give me confidence in the hypothesis, but this could be affected by the exceptions as written previously. The exceptions could have an impact on how many mistakes you make.
New hypothesis: The number of mistakes that a candidate makes during their driving test is affected by the number of one hour lessons that they have had and the instructor they have been taught by during the lessons.
This hypothesis will be focused on separating the data by the instructors whilst comparing the number of lessons and mistakes. This will allow me to see if the relationship is more reliable and if the number of lessons and mistakes relationship is affected by instructor.
Expectations: I think that the number of mistakes made will depend on both the instructor and the number of one hour lessons taken. I think this because some instructors may have better teaching methods than other. This will mean that certain candidates will learn more quickly/slower than others.
Exceptions: after stating my expectations in the introduction, there are other exceptions which may affect the number of mistakes made during a driving test.
- Nervousness: Some candidates may be more confident than others and therefore be less likely to make mistakes. Some candidates may be more nervous and make more mistakes
- Gender of instructor: The gender of the instructor and also the gender of the candidate may have an impact on how much the candidate learns in their lessons which will affects how well the candidate does in their driving test. For example, if a female candidate has his driving lessons with a male instructor, she may not learn as much as she would with a female instructor. This is because she may be more self conscious and focused on impressing the instructor rather than focusing her attention learning about driving.
- Gender of the Examiner: The candidate may be attracted to the examiner and therefore may commit more mistakes as he/ she may be more self conscious.
DATA
The data I have chosen will have a total of 24 people from each instructor. This is because the instructor C has only 24 candidates and this gives me a limitation in the size of data I will use. I will have to take the same amount of data from each candidate as by choosing the same amount of data it will be fair comparing the data from each candidate. Also the candidate will less data will be underrepresented and the candidate with more data will be overrepresented. Even though I will like to choose more than 24 candidates, I will have to stick with 24 from each instructor. Therefore, I will use all the data from instructor C and use 24 from each A, B and D. I will choose the data from A, B, and D by using the random number generator on the calculator. This will make it fair and show that my answer is unbiased. I will compare each of the instructors using both scatter graphs and box plots. This will show me if there is any relationships between the instructors.
- These are the box plots for each instructor.
- The box plot for A shows that the median is 11. The lower quartile is 8.25 and the upper quartile is 14. The inter quartile range is 5.75. This tells us that the average amount of mistakes made is 11, the lowest mistakes were 8.25, which rounds down to 8, and the highest mistakes made were 14. Instructor A has the lowest median which shows that students require fewer lessons to be at a standard where they can take the test as they have made fewer mistakes.
- The box plot for B shows that the median is 18. The lower quartile is 11.25 and the upper quartile is 23.75. The inter quartile range is 12.5. This tells us that the average amount of mistakes made is 18, the lowest amount of mistakes made was 11.25 which rounds too 11, and the highest amount of mistakes made was 18.
- The box plot for C shows that the median is 22. The lower quartile is 10.75 and the upper quartile is 29.25. The inter quartile range is 18.5. This tells us that the average amount of mistakes made is 22. Instructor C had the highest median which shows that his/her students require more lessons as they have made more mistakes.
- The box plot for D shows that the median is 16.5. The lower quartile is 5.25 and the upper quartile is 26.5. The inter quartile range is 21.25. This tells us that the average amount of mistakes made is 16.5 which rounds up to 17, the lowest amount of mistakes made was 5.25 which rounds down to 5, and the highest amount of mistakes made was 26.5 which round up to 27.
- The results show that on average the candidates which have instructor A do better in their driving test than the other instructors who make a higher average of mistakes. This tells us that instructor A is a better instructor as his candidates have made less mistakes. Also the inter quartile range is lower for instructor A which also tells us that he is a better instructor as there is less variation. Instructor A has shown more consistency in its results, whereas the rest of the instructors show more variation. This shows that candidates who have instructor A are quite consistently taking fewer lessons and it is not just a few good students
- The lowest mistakes on average were made by the candidates who had instructor A and the highest mistakes made were by the candidates who had instructor C. This tells us that the candidates who have instructor C on average made the most number of mistakes and therefore was the worst. This may be because of the exceptions stated previously. For example the candidates who had instructor A may have had previous experiences and the candidates who had instructor C may not be as good as learning as quickly as the others.
INSTRUCTOR A
- The equation of the line of best fit is y=0.07936x+9.622.
- The correlation coefficient is 0.08658. This shows positive, very weak correlation, this tells me that the hypothesis is not as trustworthy. I will need to study this further to see if there are other factors affecting the lesson/ mistake relationship.
- The gradient of the line is 0.07936 which means that every time a candidate has a lesson with instructor A they make 0.07936 more mistakes. This doesn’t fit my expectation as I thought that the number of mistakes would decrease as you had more lessons. However, this statement could be affected by other things like being nervous or the gender of the instructor.
- The y- intercept is 9.622 which tell me that when a candidate has no lessons, they will make 9.622 mistakes in their driving test. This isn’t reliable as a candidate wouldn’t take a test if they hadn’t taken any lessons.
- Perhaps gender could be an issue, as the correlation coefficient is quite low, therefore this could be groups of males and females.
INSTRUCTOR B
- The equation of the line of best fit is y=-0.3741x+25.26. There is a line of best fit which tells us that the number of mistakes decreases when you have more lessons. The odd points on this graph are represented by any exceptions as listed previously.
- Correlation coefficient is -0.3913 which shows negative, moderately weak correlation, this tells us that the hypothesis is not as reliable.
- The gradient of the line of best fit is -0.3741 which tells us that when a candidate has a lesson the number of mistakes will decrease by -0.3741.
- The y-intercept is 25.26 which isn’t valid as this tells us when a candidate has no lessons they will make 25.26 mistakes. This isn’t reliable as a candidate wouldn’t take a test if they hadn’t taken any lessons.
INSTRUCTOR C
- The equation of the line of best fit is y=-1.033x+43.35. There is a line of best fit which decreases when you have more lessons.
- The correlation coefficient is -0.9539 which shows negative strong correlation. This tells us that the hypothesis is quite reliable. It has a near perfect correlation as the candidates for Instructor C generally behave in a similar way- for every lesson they have they will make one less mistake, (as -0.9539 is so close to -1)
- The gradient of the line of best fit is -1.033 which shows that every time a candidate has a lesson the number of mistakes decreases by 1.033.
- The y-intercept is 43.35 which isn’t valid as this tells us that when a candidate has no lessons they will make 43.35 mistakes. This isn’t reliable as a candidate wouldn’t take a test if they hadn’t taken any lessons.
INSTRUCTOR D
- The equation of the line of best fit is y=-1.047x+46.99. There is a line of best fit which decreases when you have more lessons.
- The correlation coefficient is -0.8253 which shows negative strong correlation and tells us that the hypothesis is quite reliable.
- The gradient of the line of best fit is -1.047 which tells us that every time a candidate has a lesson the number of mistakes decreases by 1.047.
- The y-intercept is 46.99 which isn’t valid as this tells us that when a candidate has no lessons they will make 46.99 mistakes. This isn’t reliable as a candidate wouldn’t take a test if they hadn’t taken any lessons.
- Two students have taken twenty nine lessons but one student made 25 mistakes in their exam and the other only made 13 mistakes. Perhaps the student with fewer mistakes takes extra lessons off a family member. There are no extreme outliers and this has made the correlation coefficient very high. The relationship seems to get stronger as students take more lessons.
Conclusion: Overall the 4 scatter graphs and the box plots are all different and this tells me that the instructor definitely has an impact on how well the candidate does in their driving test. The box plots have shown that instructor A shows less variation and more consistency and therefore most candidates have been between a certain amounts of mistakes. It also shows that instructors C and D have more variation and this could be affected by exceptions like gender. From the scatter graphs I have found that instructor A and B have weak correlation and instructors C and D show strong correlation. Also instructor A has positive correlation which tells me that it doesn’t fit within the hypothesis, this could be because of any exceptions. Perhaps gender was affecting how the students learnt to drive. Some males believe they are better drivers than women, and for this reason required they need fewer lessons although they make the same number of mistakes as women.
New hypothesis: The number of mistakes a candidate makes during their driving test is affected by the number of one hour lessons that they have had, by the instructor the driver had and also the gender of the driver.
For this hypothesis, I will need to include the gender of the candidates. Therefore I will need to do the scatter graphs for both the instructor with females and the instructor with males. For instructor A and B the correlation coefficient is quite weak and therefore I will need to discard two of the instructors as the instructors for A and B doesn’t need to be tested further. I now need to test into C and D using both the female and male data. Here is the data presented as scatter graphs.
FEMALE CANDIDATES WHO HAD INSTRUCTOR A
- The line of best fit was y=-0.2175x+15.44. There is a line of best fit which decreases when you have more lessons.
- The correlation coefficient was -0.2661, which shows negative weak correlation.
- The gradient was -0.2175 which tells us that every time a candidate has one lesson their number of mistakes decreases by 0.2175.
- The y-intercept is 15.44 which isn’t valid as this tells us that when a candidate has no lessons they will make 15.44 mistakes. This isn’t reliable as a candidate wouldn’t take a test if they hadn’t taken any lessons.
MALE CANDIDATES WHO HAD INSTRUCTOR A
- The line of best fit was y=-0.7462x+24.83. There is a line of best fit which decreases when you have more lessons.
- The correlation coefficient was -0.6295, which shows negative, moderate correlation
- The gradient was -0.7462, which shows that every time a candidate has one lesson, the number of mistakes decreases by 0.7462.
- The y-intercept is 24.83 which isn’t valid as this tells us that when a candidate has no lessons they will make 24.83 mistakes. This isn’t reliable as a candidate wouldn’t take a test if they hadn’t taken any lessons.
FEMALE CANDIDATES WHO HAD INSTRUCTOR B
- The line of best fit was y=-0.06399x+18.41. There is a line of best fit which decreases when you have more lessons.
- The correlation coefficient is -0.06176, which shows negative very weak correlation.
- The gradient is -0.06399, which shows that every time a candidate has one lesson, the number of mistakes decreases by 0.06176.
- The y-intercept is 18.41 which isn’t valid as this tells us that when a candidate has no lessons they will make 18.84 mistakes. This isn’t reliable as a candidate wouldn’t take a test if they hadn’t taken any lessons.
MALE CANDIDATES WHO HAD INSTRUCTOR B
- The line of best fit is y=-0.7075x+31.13. There is a line of best fit which decreases when you have more lessons.
- The correlation coefficient is -0.7871. This shows negative fairly strong correlation.
- The gradient is -0.7075, which tells you that every time a candidate has a lesson their number of mistakes decreases by 0.7075.
- The y-intercept is 31.13 which isn’t valid as this tells us that when a candidate has no lessons they will make 31.13 mistakes. This isn’t reliable as a candidate wouldn’t take a test if they hadn’t taken any lessons.
Conclusion for cycle 3
I found that the males in both instructors had a better correlation coefficient which shows that they have more consistent results. The female’s results in both instructors have more variability. Therefore this shows that males are better at learning with the instructors A and B than females learning with instructors A and B
At the start of the project the data was very scattered and the correlation coefficient was quite weak. Even though the points were scattered, there was a slight trend showing that as your number of lessons increased the number of mistakes decreased. Therefore I decided that I should also take other factors into account and see if they affect the relationship between the number of lessons and number of mistakes.
In cycle 2 I was looking at the relationships between the number of lessons and number of mistakes and also taking in account of the instructors. This gave me an idea of how many lessons people took and how many mistakes people made. Overall, I concluded that Instructor A seemed to be the best instructor as his/ her students were mostly making very few mistakes although they took the least amount of lessons. However, when the two were compared, it showed that the relationship between lessons and mistakes was very weak for Instructors A and B. Therefore, this was needed to be studied further. On the other hand, instructors C and D showed a very good lesson mistake relationship, which suggests that males and females learnt to drive as equally as well as each other. Therefore I didn’t test the data for C and D further.
Whereas in cycle 3 I found that the gender of the driver also affects the lesson and mistake relationship. This shows that whoever male drivers are with, they perform the same. However, the female drivers show difference in performance when with different instructors. With the limitation of not having enough people with instructor C I could not see if gender also affected the lesson and mistake relationship so due to the relationship being very strong in cycle 2 I did not include the data in cycle 3. I also didn’t include instructor D as the correlation coefficient was very high in cycle 2 and therefore didn’t need to be tested into further. The best drivers seem to be the males of Instructor B, and the male instructors of instructor A and they seem to get the best value for money as for every two lessons taken, almost 3 less mistakes are made (approximately). Lessons are expensive, so these students have saved the most money, or made the most use of the money they spent.
One of the limitations of the project was that there were not enough candidates of Instructor C, so this limited the data. The results I had may not have been reliable but the data seems relatively reliable and not too biased.
All the way through males seem to be the better drivers. Referring back to the original hypothesis, the number of lessons does affect the number of mistakes made, but this relationship is also affected by gender and instructor. Furthermore, it can be seen that males seem to be better drivers although they are unaffected by instructor. Women are not as good drivers so gender affects performance, but females also show that instructor has an affect on how well a person performs in their driving test. Overall, if I was one of the candidates I would choose instructor C mainly because gender wouldn’t affect the number of mistakes and also because the number of lessons against mistakes are quite low.