Overall - 111 Overall - 115
Total population: 226
Year 8 total: 111
Year 12 total: 115
Year 8 ratio: 111: 226
Year 12 ratio: 115: 226
Year 8:
111/226 x 120 = 59
Year 12:
115/226 x 120 = 61
The gender ratio of year 8 is 58 males to 53 females
Male: 58 / 111 x 59 = 31
Female: 53 / 111 x 59 = 28
The gender ratio of year 12 is 50 males to 65 females
Male: 50 / 115 x 61 = 27
Female: 65 / 115 x 61 = 34
So In order to take a stratified sample of 120 students, the required amount of students from each year would be:
59 Year 8’s, consisting of 31 boys and 28 Girls
61 Year 12’s, consisting of 27 boys and 34 Girls
There is a problem with this amount of people. There are only 28 Year 8 females, and 27 Year 12 males if the sample is stratified. I will have to increase the amount of pupils in the sample, as any amount under 30 is not considered representative of the sample. In order to attain a representative stratified sample for all gender and year groups, I will take a sample of 140 people.
140
I will now calculate my stratified sample for 140 results.
Remembering my populations of year 8 and year 12:
Year 8:
Female - 53
Male - 58
Overall - 111
Year 12 population:
Female - 65
Male - 50
Overall - 115
Total population: 226
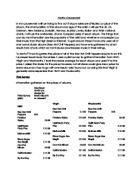
Firstly, for a stratified sample I will need to calculate haw many year 8s and year 12s I will need.
Year 8
Year 12
From my calculations I have determined that I will require:
69 Year 8 and 71 Year 12
I now need to calculate how many of each gender group I will have need in order to obtain a representative stratified sample
Not forgetting the gender ratio of year 8: 58 males to 53 females
Year 8 Males: 58 / 111 x 69 = 36
Year 8 Females: 53 / 111 x 69 = 33
Or the gender ratio of year 12: 50 males to 65 females
Year 12 Males: 50 / 115 x 71 = 31
Year 12 Females: 65 / 115 x 71 = 40
Both year groups add up to 69 and 71, so my sample of the population amounts to 140 people. I have now determined that this is a representative stratified sample and I will proceed to use at least 140 people in my sample for my investigation.
Many factors need to be considered when choosing a suitable area of estimation to investigate. I believe that the main one is that of time consumption, how long these results will take to collect. Estimation of time per person seems very time consuming, and if it were to be done by groups of estimators at the same time their estimations may easily influence each other. Weight, while not as awkward as estimating time, is still time consuming. As seen in Patricia’s investigation in the previous section, people may estimate in different units and also estimate extreme values. This will only prolong the analysis of the estimations with the task of converting these units. I have chosen to investigate the measurement of length and angle of a line. Michael used this previously in the secondary data.
Michael’s results consisted of a scatter graph comparing the percentage difference in estimation that 28 people got in estimating the length and angle of a line. I have already improved upon the reliability of the results with my representative and stratified sample, and I will also be able to obtain more conclusions from my results as, unlike Michael’s results, I will know the age and gender of all the people from whom I obtain my results
Although in the previous section Michael did not specify any actual values, his investigation suggested a definite correlation between the estimation of length and the estimation of angle, this is why I have chosen to use length and angle in my own investigation.
The actual line and angle being estimated will have their sizes kept consistent. They will be drawn on an A4 page, because it is the most convenient and appropriate, especially for photocopying/ distributing.
The lines are limited in length by the size of the A4 sheet, and the angle will be restricted to less than 180 – degrees.
Both lines will be drawn by my class teacher to eliminate the possibility of any bias in the estimations taken from the population and of course both length and angle of these lines will remain constant.
After recording the results of my investigation I will put them into a Microsoft excel spreadsheet. I will then calculate, via the Excel spreadsheet, the percentage error of the results.
I will then analyse these results and make various diagrams such as scatter graphs etc, and compare estimation of length to estimation of angle, also the effect of gender and the effect of age on estimation.
In the primary data that I have collected, there were some problems; people were absent, some handwriting was illegible and some students left out their name s on the sheets. These all proved hard to deal with, so they were disregarded and replaced using extra results that were collected for such problems arising.
A few students have estimated in inches, whereas the majority of people have estimated in centimetres. I will convert those values estimated in inches to centimetres by multiplying them by 2.54.
I now have metric measurements for all of my results and can proceed in finding the percentage error.
My first hypothesis is that people who are good at estimating length will be good at estimating angle.
This is prompted by Michael’s research in my secondary data, where there was a clear correlation between estimation of length and angle.
Firstly I used excel to calculated the mean of the percentage errors for both length and angle:
Mean for length = 14.50
Mean for angle = 5.98
The Calculation of the mean shows me that on a whole, people are better at estimating angle than length as the mean percentage error was lower for angle than length by 8.52%. I will now use Excel to calculate the median to try and justify this.
Median for length = 10.29
Median for angle = 3.96
The Calculation of the median also showed that people are generally better at estimating length that angle. Showing a difference of 6.33 % in favor of angle.
Using excel, I have drawn a scatter graph portraying the percentage errors of my results:
The first thing I notice when I look at this graph is that they’re several clear, anomalous results.
I would like to remove any outlying results. All of the anomolus results on this graph appear to be large numbers and so could only be an upper outlying result, and to work out which results are out lying, I must first find the upper and lower quartiles, and hence the inter quartile range before I can do this.
The lower and upper quartiles for length are:
Q1 = 4.41 So the I.Q.R = 14.71
Q3 = 19.12
The lower and upper quartiles for Angle are:
Q1 = 0.99 So the I.Q.R = 6.93
Q3 = 7.92
The formula for upper outliers is:
Q3 + 1.5(I.Q.R)
So for length that would be:
19.12 + 1.5(14.71) = 41.19
For angle it is:
7.92 + 1.5(9.93) = 22.815
So for Length I have found 7 outliers
And for angle there are 3 outliers
Having taken out these results I find that there is no real correlation between length and angle. So my hypothesis has been disproved, people who are good at estimating length are not always good at estimating angle.
I have also discovered due to my calculations of mean median and the Inter Quartile Range that people are generally better at estimating angle than length, but with little correlation between it and length.
In the secondary data, none of the information specified the ages of the estimating population. Patricia’s results gave some insight with imperial measurements etc, but this was not accurate, so I am now going to investigate the effect that age has on estimation.
My second hypothesis is that there is a link between estimation and age, and that year 12 will be better estimators than year 8s. I will investigate whether or not this hypothesis is true by using the percentage error of the estimations in my primary data, presenting my findings in scatter graphs.
From these graphs, it is very clear that Year 12’s were much better at estimating angle, with the highest percentage error in angle being under 20%, while several Year 8’s made estimations with over 30% error. Whereas both age groups made estimations of length with a high percentage error
Upon removing the outlying results, I can tell that Year 12’s are the better estimators of angle. Several of the Year 12s made estimations of length with a high percentage error. The percentage error in length is higher than the percentage error in angle.
My hypothesis has been proven, as year 12s are better estimators than year 8s.
It is possible that in my second hypothesis that the gender distribution of each estimating group could have manipulated or distorted the results. By investigating the effect of gender on estimation, I will be investigating a new hypothesis, and simultaneously adding to my second.
My third Hypothesis is that year 12 girls will be better estimators than year 12 boys. To investigate this I will display the percentage error of each gender of each year group in a scatter graph
.
With the exception of 3 out lying results for females in year 12, they show a great correlation of estimation of angle to estimation of length. Their mean percentage errors are:
Length: 12.59
Angle: 4.16
And the males are:
Length 13.94
Angle 4.28
On both accounts the girls are shown to be better estimators. This would suggest to me that girls are better estimators and that my third hypothesis h\s been proven.
My conclusion is that there is no correlation between estimation of length and angle. That age has a direct correlation with estimation, and that gender has a correlation to estimation in that girls are better estimators than boys.
If I were to do this experiment again…
Do r squared correlation thingfor 1,2,3
Do more Calculations for 2 and 3
Do better conclusion and compare to section A
Do recommendations for future experiment
Change wording