- Generalize and form this for any area of your choice, use your understanding to show situation where we can use the concept of minimizing perimeter. Solve the example below and give two more examples.
For the general equation of finding the minimum perimeter of a figure with a given volume, I use the method of trial and error to find. I first square rooted the area. The answer I got was actually the minimum perimeter divided by 4. So I got the formula:
Or
.
Nadine wishes to grow vegetables on her property. She wants a rectangular garden of area 1600 m2 and needs to build a fence around it to stop her goats eating the vegetables.
Help her decide the dimensions of the rectangular garden of area 1600m2 which minimizes her fencing costs.
As seen in the data below, the least value for perimeter is 160m but the dimensions are 40 X 40 which is a square as all the sides are equal. But the question asks for a rectangle with the least perimeter. But if we consider a square to be a rectangle, then the answer is:
Checking with the general formula:
which is 160
Example 1: A card company makes greeting cards based on the perimeter of the card. A person wants to buy a card of area 6m2 for an occasion. She wants to minimize her costing. Suggest the dimensions of the card that would cost her the least.
As seen above, the best dimensions of the card with 6m2 of area are 2.4m by 2.5m or vice versa.
Proving with general equation:
which is
Example 2: An artificial lake is being made. The required area is 50 m2. Minimizing the perimeter is important to minimize the cost of the walls. Suggest the dimensions of the lake wall so that minimal perimeter is acquired.
As seen above, the minimum perimeter is achieved when the dimensions are 7m by 7.143m with a perimeter of 28.286m while maintaining an area of 50m2. Proving with the formula:
which is 28.28
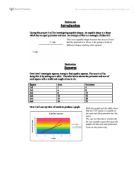
MAXIMIZING AREA
Anna has 40 m of fencing. She wishes to form a rectangular enclosure in which she will keep chickens. To help maximize the area she can enclose, she uses an existing fence. The 40 m of fencing forms the other three sides of the rectangle. Your task is to determine the rectangular shape, which encloses the maximum area of ground.
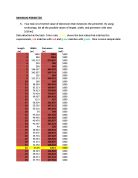
- Your task is to find the value of dimension that maximizes the area. By using technology, list all the possible values of length, width, and area with fencing 40 m.
The data is attached at the back. Color coding: Yellow is width, blue is area.
The data that satisfies the solution is most area which is 200m2 with the length=20 and breadth=10.
- Make a formula and predict the kind of graph and test if the hypothesis holds on your findings.
As this formula is about area, we will use the area formula:
We will also use the perimeter formula, but in this only three sides are equal to the perimeter.
Isolating l,
Substituting to the area equation,
(Where x is equal to the width or breadth)
To prove my formula, I will use 2 examples:
X=2
When x=2 the area is:
X=4
When x=4 the area is:
So, we can see above the formulas function properly.
We can also prove this equation by another method. As the graph is a parabola, it is a quadratic equation. By using the standard quadratic equation, we can find the equation:
Taking three points on the graph (1, 38), (2, 72) and (3, 102) and substituting to the general quadratic equation
,
Solving them simultaneously,
1X4…..
…….1’
1’-2……
……..4
1X9….
……..1’’
1’’-3…….
…….5
4X3…….
So
. Substituting to 5,
. Substituting to 1.
So,
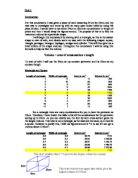
The graph of this equation is quadratic as visible from the equation and the data. And the data increases first, and then decreases, it displays a parabolic behavior. The equations too are in the power of 2, making it a quadratic curve or parabola. To prove this, here is the graph:
- What relationship do you observe?
This graph is a quadratic graph also known as a parabola. This graph is an upward parabola because the co-efficient of x2 is negative. At the beginning of the graph from 1 to 10, the graph is increasing and later on from 10 to 20 it is decreasing. This shows that this is a quadratic equation which is also visible from the equation and graph. As there is no y-intercept in the graph, the value of c is 0. In this case we also observe that the area is the highest when the dimensions are close to that of a square.
- What degree of accuracy have you used in your findings? Why?
I have used one decimal place in my data for length and width and two for my area. This makes my result and my method quite accurate as there is a high degree of accuracy. I did this so that there is no repetition of any data, as said earlier, the data was quite close, so using a accuracy of 1 decimal place would give me repeated data, and thus cause a negative impact on the graph too. As I have made use of technology to calculate my results, they are even more accurate as there is very less room for error. I have also done this for very accurate data which is better than the ones with lower decimal places, while giving me the same graph as any higher decimal places.
- Suggest any method that you may use for the improvement of your work.
Although my graph, findings and formulae I have used are very accurate, I could have made a few changes in my investigative. I could have used another graphing software instead of Excel, I would have gotten a much accurate graph than the one attached above. I could have also used it to confirm my graph and my findings. As I have used three methods to find my equation, my equation is very accurate. But forming another equation would also increase the validity of the results. I could have also used the graph to find the equation of the graph which would improve the accuracy of my equation.
- Janeth started her own summer business -putting on birthday parties for small children. Because all the children wanted to sit together, she had to place the card tables together into rectangles. Only one child could sit on each side of a card table. Her first party had eighteen children. How many tables did Janneth need to borrow with a maximum area?
For finding the general equation to find the maximum area, I just tried modifying the formula used for finding the minimum perimeter in terms of area. So the general equation is:
As we can see below, the best dimensions that maximize the area are 5 tables by 4 tables where 20 tables are required. But if we don’t include the tables in the center, than only 14 tables are required, thus this is the best dimension. This also goes along with my hypothesis saying that the area is the highest when the dimensions are the closest to that of a square.
Checking with general equation:
But as tables cannot be in decimals,
Example 1: A child is building a model of a house. She has a limited perimeter of the base Styrofoam of 8m. Help her choose the dimensions of the Styrofoam to maximize the area.
The maximum area is achieved when the Styrofoam is with the dimensions 2m by 2m with the area of 4m2. Checking with the formula:
Example 2: A company has to build a swimming pool in an apartment. They have a limited amount of concrete to build enough wall to cover 100m. Formulate a dimension that will help maximize the amount of area they can cover, so that a larger pool can be built.
As seen above, the dimensions that maximize the area are 25m by 25m giving an area of 625m2. We can again see that these dimensions are of a square, again satisfying that the dimensions closer to that of a square are the ones that make the largest area.
MAXIMUM VOLUME
- Your task is to determine the size of the squares, which should be cut from each corner of a 24 cm by 18 cm sheet of tin plate so that the final dish has maximum capacity. A spreadsheet can be used to calculate the length, width, depth, and capacity of dishes with various sized squares cut from each corner of the sheet of tin-plate.
The data is attached at the end of the investigative. The data highlighted in yellow is the data that matches the requirements. Here is some sample data:
The answer is when the volume is equal to 654.956 cm3 when the size of the square cut of is 3.4 cm.
- Make a formula and predict the kind of graph and test if the hypothesis holds on your findings.
To find the equation for this graph, we can use the general equation of cubic curves:
We substitute a, b and c with the roots of the graph (when the graph cuts the x-axis).
Solving this:
Substituting a value for x and y to get a,
So,
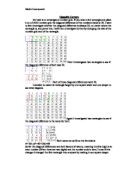
As we can see the equation has a highest power of 3. Thus the graph should be cubic. As it has no value for c, the graph will not cut the y-axis. To prove this hypothesis, the graph is on the next page:
To prove my formula I will make use of two examples,
X=2
X=3
- What relationship do you observe?
This graph is a cubic graph as the highest order in the equation is 3. The graph has no y-intercept, therefore the value of c=0. The graph increases from 1 to 4 the decreases continuously till 10.5 and then continuously increases on. This results in a graph with one upward parabola and one downward parabola or also known as a cubic curve.
- What degree of accuracy have you used in your findings? Why?
In my findings I have used a degree of accuracy of 3 decimal places in volume and the rest as 1 decimal place as to get accurate data and graph. . As I have made use of technology to calculate my results, they are even more accurate as there is very less room for error. As I have a high degree of accuracy, my data, method and graph are very accurate. I took 3 decimal places as it is accurate enough to give a proper and accurate graph. I have also done this for very accurate data which is better than the ones with lower decimal places, while giving me the same graph as any higher decimal places. As I have made use of technology to calculate my results, they are even more accurate as there is very less room for error.
- Suggest any method that you may use for the improvement of your work.
Although my results and graph are very accurate, I could still improve them by doing many other things. Although I have found my equation using a very reliable, I could have also used other graphing software to plot and find the equation of the curve. I could have used 2 decimal places for the values of length and width to get more accurate results and graphs. I could have made use of another method to find my formula, as it is not reliable because it is formed using only one method. These are some of the methods I could use to improve my work. I could have also used Microsoft Excel to find the equation of the curve.
- Generalize and form this for any dimension of your choice, use your understanding to show situation where we can use the concept of maximizing the volume. Solve the example below and give two more examples.
A box must have base x cm by 2x cm. What are the dimensions of the box of maximum volume if its length + width + depth ≤ 140 cm?
Using the basic dimensions as 28cm by 22cm:
So the dimensions that give the maximum volume with the sheet of size 28cm by 22cm is with the dimensions 11cm by 22cm by 107 cm. I could have gone further, but as the size of the width of the sheet is on 22 cm, this is the maximum volume available.
Example 1: Packaging companies require maximizing their volume in order to decrease packaging cost and put more food in the box. Suggest the dimensions of the box with the most volume for a plastic sheet 20cm by 15cm.
The maximum volume achievable for this dimension is 7.696cm3 with the dimensions 5.2cm by 0.2cm by 7.4cm.
Example 2: A bottle manufacturing company is making special cuboid shaped bottles. They have little budget to test the bottles on people, so they have to maximize the volume. Suggest the size of the square that should be cut off from a 50cm by 25cm to maximize the volume.
The maximum area is achieved when the dimensions are 39.6cm by 14.6cm by 5.2 cm with the volume as 3006.432cm3.