Maths Mice Coursework
Extracts from this document...
Introduction
Mice Coursework
Introduction
In this coursework I am going to compare two sets of data about the weight of male and female mice. I am then going to make a hypothesis about the weights of these mice and then find out whether or not I am correct.
Hypothesis
My hypothesis is that male mice will be heavier than the female mice. I think this because usually males need to eat more and tend to be bigger.
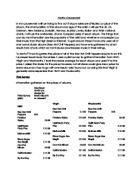
Grouping the Mice.
In this coursework I will also have quite a few graphs.
Middle
Frequency (f)
Midpoint (X)
f x X
0 ≤ w < 5
5 ≤ w < 10
10 ≤ w < 15
15 ≤ w < 20
20 ≤ w < 25
25 ≤ w < 30
0
1
20
45
21
7
2.5
7.5
12.5
17.5
22.5
27.5
0
7.5
250
787.5
472.5
192.5
Total: 94
Total: 1710
So the mean average of male mice is 1710÷94= 18.20 (2 d.p. places)
From this we can already see that on average male mice are bigger in weight.
The next step that I will take is to draw the cumulative frequency graphs. I am drawing the cumulative frequency graph so that I can calculate the median value. The reason for this is because it
Conclusion
0
19
29
7
25
27
0
19
48
55
80
107
Male
Groups | Frequency | Cumulative Frequency |
0 ≤ w < 5 5 ≤ w < 10 10 ≤ w < 15 15 ≤ w < 20 20 ≤ w < 25 25 ≤ w < 30 | 0 1 20 45 21 7 | 0 1 21 66 87 94 |
Graphs
Mean Values
Female: 18.5G
Male: 18G
According to these mean values Female mice are heavier than Male mice.
This student written piece of work is one of many that can be found in our GCSE Miscellaneous section.
Found what you're looking for?
- Start learning 29% faster today
- 150,000+ documents available
- Just £6.99 a month