The Independent
Graphical representation of data
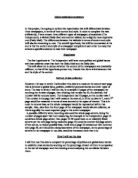
I have chosen to represent this data in the form of pie charts, as I believe that they are easily comparable by simply looking at the pie charts, of course the topics of interest in this case are politics, global issues and celebrity/personal stories.
Daily Mail
Daily Star
The Independent
Observations
As a result of the calculations I’ve made and the diagrams drawn, I am able to comment upon the hypothesis I’ve made, having a look at the pie charts, my hypothesis does appear to have been proven. The Daily Mail and the Daily Star both respectively have 21% and 32% of their papers devoted to celebrity and personal news, in addition to the fact that overall, the Independent has 35% of its newspaper containing Global Issues in comparison to 1% of personal stories. The Daily Star has 1% of politics, with absolutely nothing on Global Issues, such as the fighting in Burma, with the Daily Mail having a whopping 7% of Global Issues and Politics combined.
Conclusion
It is safe to say that my hypothesis has been proven and that the Independent has more Politics and Global Issues with less celebrity news than the Daily Mail and the Daily Star.
However, there are some possible issues that may have arisen with regards to my sampling, in that in the Daily Mail’s case, I took data from every 9th page, which may have meant I missed a lot of politics and global issues that would’ve been towards the front of the paper, however with margins between the Independent and the Daily Mail’s percentages so wide, it is rather probable that my hypothesis is correct and I will assume so. But, if there ever was a possibility for further investigation, it would be to further investigate the Daily Mail, by possibly taking more pages into the sample, in order to account for the more pages the newspaper had.
However, I am reasonably happy that my conclusions are reliable as the gap between the tabloids and the broadsheet paper are so wide, that it is highly unlikely that there is a huge fault with my results, other than that there are ways to make it more reliable.
Hypothesis
My second hypothesis, which will focus upon style rather than content, is:
A broadsheet newspaper will be more difficult to read than a tabloid paper.
Method of data collection
For this hypothesis, I have decided to collect data that reveals the amount of syllables per word in articles in the three newspapers, this is because I feel that the amount of syllables is a good way to measure the readability of an article, as the more syllables within a word, the harder the word is to pronounce. Also, it is more likely that a newspaper that uses more complex, stylish, flamboyant language is likely to use words with many syllables as they are associated with complex language.
However, I can outline now that there are other ways to measure the readability, namely the amount of clauses on average a sentence has, as this can be a good indicator of how difficult something is to read, but in this case I have decided that the measure of calculating data from the amount of syllables within a word is the better one.
In order to reduce bias, I am going to take an article from each paper, approximately a third of the way in, in order to reach a point at which each paper has individual, unique articles that will not be termed similarly by using certain key words. It is my belief that the newspapers would have filled their quota of necessary news to report, and then will be focusing on what they individually specialise in. Also, the articles had to be approximately 600-700 words long, in order to take a good spread of vocabulary from it. The articles that ended up being used were; from the Daily Star, an article on some TV awards that had taken place the night before, the Daily Mail were reporting on controversy surrounding Slovakian unrest in regards to an episode of Michael Palin’s Eastern Europe, whilst the Independent were reporting upon the Chinese so called ‘cultural revolution’ with the introduction of modern technology in Shanghai and how it has changed the face of the city. All these articles are pretty much individual to the respective papers and therefore the style of writing on vocabulary used will be extremely different and also therefore be representative of each papers individual style.
I will try to make my data reliable, by counting every third word in an article between 600 and 700 words, this will not include, however, names of people and places, as they do not reflect the style of the writers, but merely the names of who or what they are writing about.
Possible difficulties with this would be if I were to get several names and places in a row, in order to avoid this, I will continue onwards, discounting those, but continuing beyond the 600 word mark until a sample of 200 words has been collected. I feel a sample of 200 words would be fitting, as it is large enough to take the general style of an article in, but not so small that there may be some misrepresentative anomalies.
How I will use the data
I will use this data to compare the three different styles of newspaper, I will do this by comparing the means, medians and the general trends of the amount of syllables per word within an article and this should be able to highlight the differences in style between the newspapers. In fact, what should happen is that the Independent would prove to have the most difficult to read article, by which it would have a higher average of syllables per word in comparison to the other two newspapers, as well as having words with the most amount of syllables, meaning that the curve within a cumulative frequency graph would be the longest whilst continuing to rise. I also predict that it will have the least number of one syllable words in comparison to the Daily Mail and the Daily Star.
I have chosen to represent this data initially as tables, but then to graphically present the data in the form of cumulative frequency graphs and box and whisker plots, as they are the best way to compare the different pieces of data.
As you can only have a whole syllable, the data cannot have any midpoint values to multiply by, so cumulative frequency can be calculated by simply adding all the numbers up together.
Data
Daily Mail
Daily Star
The Independent
The data found in the above tables, can easily be represented, rather simply, by cumulative frequency graphs, as follows.
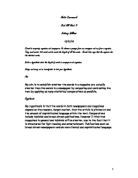
Daily Mail
Following this is the box and whisker plot which summarises the data contained within the cumulative frequency graph.
This box and whisker plot shows that the lower quartile is 0.4, the median is 1 and the upper quartile is 1.35, yet the maximum recorded syllables was 5. Therefore the interquartile range was 0.95. A piece of data retrieved from the table is that the mean syllables per word within this paper, the Daily Mail, was; 1.51.
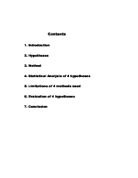
Daily Star
Again, following is the box and whisker plot which summarises what is shown in the cumulative frequency graph.
This time, the box and whisker plot shows that the lower quartile is 0.35, with upper quartile being 1.05, meaning that the interquartile range is 0.7. The maximum recorded syllables for a word in the Daily Star was 4. A very important piece of data retrieved from the graph was that the mean syllables per word for the Daily Star was; 1.395.
The Independent
Again, below the cumulative frequency graph will be a box and whisker plot to summarise what is in the graph.
In this, it is shown that the highest recorded syllables in a word is 5, the median is 1. It is shown that the lower quartile is 0.4. The upper quartile is show to be 1.6. This makes the interquartile range for the Independent; 1.2. Also, retrieved from the table is the mean amount of syllables per word, which of course is a very important piece of data. In this case, the mean amount of syllables per word is 1.69.
Observations
From this data, all three newspapers can be compared; first I will begin with comparing the mean syllables per words in the three newspapers. To make this clear I will write out all three results one after the other.
Daily Mail -1.51
Daily Star – 1.395
Independent – 1.69
First of all, the tabloid Daily Star has the lowest mean of syllables used per word, this gives the impression that the wording and style of the article was rather simple and basic, very readable and the style was not very sophisticated, meaning that the paper is possibly aimed at less educated backgrounds than for example the Guardian, as it’s average syllables per word is 1.69, the highest of the three newspapers, which does indicate that it is more difficult to read than the other two. So far, the mean data collected does seem to tally with the hypothesis made that broadsheet newspapers are more difficult to read than tabloids.
Next are the interquartile ranges of the newspapers, obviously a larger interquartile range would indicate that there is less use of monosyllabic words, as the higher upper quartile would show more that there are a large number of polysyllabic words, namely a larger percentage of words with 2 or 3 syllables than the other papers, as a higher upper quartile would indicate that generally there is more use of longer, polysyllabic words with fewer one syllable words. Rather than simply showing there may be a few words with a ridiculous number of syllables that push just the mean upwards. The interquartile ranges of these papers are;
Daily Mail – 0.95
Daily Star – 0.7
Independent – 1.2
Conclusion
Again, these results move close to proving my hypothesis that the broadsheet newspaper are more difficult to read than the tabloid newspapers. In fact, this indicates that the style of the newspaper is in the case of the Independent, is rather sophisticated, with more polysyllabic words being used in it than in the other two tabloid newspapers, which shows that it is more difficult to read and is appealing to a different audience than for example the Daily Star. Which in my opinion is rather patronising in the sheer amount of monosyllabic words used that could be said it is ‘dumbing down’ the newspaper and appealing to the audience that is likely to be lesser educated. The Daily Mail is in the middle of both of these, it is not overly sophisticated in that the masses would not be able to comprehend the newspaper, but simple enough that most would be able to read and understand the newspaper. I feel my hypothesis that a broadsheet newspaper is more difficult to read than a tabloid newspaper has been proven by my results.
Evaluation
I feel my method has been rather effective in that it has delivered the answer to the questions I posed that I wished to receive, however I am certain that there are ways that I can easily improve the results with further testing, by possibly measuring how long it would take people to read the articles and possibly posing a questionnaire to them on how they felt about the readability of the articles.
Also, a bigger sample could provide more reliable and accurate data, as my sample is relatively small. However I feel that it is representative enough, as has been proven by the results from the investigation.
Final conclusion
It is easy enough to see that there are links between the content of newspapers and their style, which can be shown by which audience they are targeting. I feel that the broadsheets with mainly political content, with a lot of focus upon global issues are aiming towards the people who are likely to be well educated as well as probably having an active interest in politics and global issues, of course; otherwise there’d be no reason to report on these issues inside their newspaper. The style is rather sophisticated, with polysyllabic words being commonplace in comparison to the two tabloid newspapers, this really does emphasise the fact that they are focusing upon those who are likely to have gone through higher education, those with high comprehension skills who would also have interest in topics that go beyond what personally affects them. The way in which content and style compliment each other is what indicates that this is the case.
Whereas the Daily Mail appears to be trying to grab the attention of the average person, as it has a fair bit of politics, albeit low in comparison to the Independent, yet maintains enough personal stories to provide entertainment for those people whilst remaining quite relevant to current events and actual news. It’s style also compliments its aims, as it is not exactly difficult to understand, but not so much so that it’s use of language can be described as merely simple. It is plain to see that they are trying to capture all possible audiences by offering a generous mix of everything, with a style that most people would be able to comprehend fully.
The Daily Star, in complete contrast to the Independent, provides very little political analysis, nor does it at all cover global events, although far from home they may be of interest to some people, but it is plain to see that the Daily Star is not targeting that audience in the slightest, with a tiny bit of politics, possibly included so they can retain the title of ‘newspaper’ as the rest of the paper rarely contains any actual news, it focuses more on TV and celebrity stories, with a generous amount of sport. This, coupled with the use of simple, monosyllabic language shows that they don’t seem to be aiming towards highly educated people, or even the average person but more towards those with little sense of comprehension and those who may not fully understand the effects that politics and global news may have on their own lives.
In conclusion, my investigation through two different hypothesise has proven how the content and style of a newspaper compliment each other and attract a specific audience. The style and content varies with the audience they are looking to attract and that a broadsheet will have more politically focused content than a tabloid, whilst using a more sophisticated style. The tabloid aimed at those with less interest in politics, which would often be aimed at those with less education than most, in this case the Daily Star, would contain a lot more television related content and would especially focus upon celebrity news and gossip, whilst using a simple easy to comprehend, often monosyllabic style of language to attract their audience. Whilst another tabloid, which aims itself at the vast majority, in this case the Daily Mail, would use a blend of political and celebrity content, a balance between them, but using a style that is not difficult to comprehend but is not entirely simple nor is it completely ‘dumbed down’.