A more commonly used and accurate method of measuring spread is standard deviation. The standard deviation is a statistic that tells you how tightly all the various examples are clustered around the mean in a set of data, although it is effected by very large or small values. When the examples are tightly bunched together the standard deviation is a low figure. It is important we get an accurate representation of what the spread is like as spread measures how closely the data is clustered. As expected, the largest is Key Stage 3 with 9.56396, then 4 with 9.2567, and the smallest is Key Stage 5 with 8.07393. Again this suggests that Key Stage 3 has most variation in the estimates and so is therefore least consistent (although Key Stage 4 is less than 1 different so also isn’t consistent), and Key Stage 5 is the most consistent, with least variation in the estimates.
However, to understand how accurate the estimates are from the standard deviation, we need to look at the mean. The mean uses all of the data, finding the sum of all the data points and then dividing by the number of data points, meaning that a mean closest to zero will be the most accurate. But the mean is therefore affected or distorted by very large or very small values, as may well be the case for Key Stage 5, as it’s lowest value is considerably lower than it’s highest value. This may or may not explain why Key Stage 5’s mean is further away from zero (-3.14636) than Key Stage 4’s mean (-2.74163), as this is quite unexpected. Unsurprisingly, Key Stage 3’s mean is very far off from zero at -6.01616.
This means that in fact Key Stage 5’s values are closely bunched (due to standard deviation) around a value that is further away from zero % error and therefore less accurate than Key Stage 4. Although Key Stage 4’s data is less consistent, it is less consistent around a value very close to zero, suggesting many pupils in Key Stage 4 guessed very accurately, on a contrary to my hypothesis.
The median and the skew of the box plots also seem to suggest this. Again Key Stage 4’s median is the closest to zero (-1.36), Key Stage 5’s median is further from zero (-4.76) and Key Stage 3 is further still (-6.16). This means on average Key Stage 4 were much more accurate than Key Stage 5, and the skew only emphasizes this point. We can see that in Key Stage 4’s box plot, there is a positive skew as the median (-1.36) is closer to the upper quartile (2.04). This means that the majority of the estimates were between -1.36% and 2.04% error with fewer below -1.36, giving incredibly accurate estimates. Whereas in Key Stage 5’s box plot, there is a negative skew as the median (-4.76) is closer to the lower quartile (-6.16). This means most of the estimates are between -4.76 and -6.16 and fewer above -4.76, extremely far off zero compared with Key Stage 4, and therefore the estimates are much less accurate. Of course, Key Stage 3 complied with the hypothesis, with a negative skew even more than Key Stage 5, with both the median and upper quartiles being -6.16.
Overall, my results do not comply with my hypothesis entirely. Key Stage 3 were by far the least accurate at estimating, which does conform to the hypothesis as they are the youngest. However, Key Stage 5, although being more consistent than Key Stage 4, were much less accurate as estimating. This does not conform to the hypothesis and is completely unpredicted, not only due to their superior mathematical experience but due to the fact that they are all of an upper ability as they chose to do the subject. The only explanation I can give for Key Stage 4’s superior performance is that they may have been learning about estimating angles more recently so will be in better practise than those studying A level maths, who may be out of practise due to the lengthy time period since learning to estimate angles.
However, I do not believe this to have caused such a drastic impact on results, therefore I am not ready to discount my hypothesis of estimating ability increases with age. Consequently, I shall now investigate the other hypotheses mentioned previously; whether the ability or gender had an effect on accuracy of estimating angles, and whether this has affected my first hypotheses. Although for these investigations I will be using all of the data, because otherwise there would not be enough data to get a representative sample of the students in each category. I will still be excluding any outliers above 50% error.
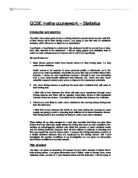
Investigating Hypothesis 2
I will now investigate my second hypothesis – the higher the band you are in, the better you are at estimating. After looking at age on its own, with no other variables being analysed, I believe it to be necessary, in order to further my investigation, to see how the mathematical ability of a student affects their accuracy of estimating. Of course, I predict that the higher the ability of the student, the higher their accuracy of estimation, but I will see if this is actually true. The maths ability of the student is measured by the band that they are in; higher, middle or lower band. I will not be including Key Stage 5 in this part of the investigation as it only has higher band ability, and therefore I cannot compare this to any other ability of the same age.
Results
This is how the results look in box plots for Key Stage and ability, with all of the key statistics shown around the sides:
Analysing the Data
The first thing that is noticeable just by looking at the box plots is this time the semi inter-quartile ranges are again all the same as before (5.1) for all of the box plots apart from KS3 Lower band. Again this is unusual, but what it does tell us is that, ignoring the highest and lowest values, ability does not have a great effect on overall consistency of the estimates, apart from in KS3 where there is less overall consistency in the lower band.
We must also look at the spread of data by looking at the range and standard deviation. The ranges for each set of data are not exactly as I would have expected. In both Key Stages, upper band has the lowest range, as expected as they should be the best and most consistent at estimating in their Key Stage. However, the middle band’s ranges in both Key Stages are actually the highest, whereas I would have expected the lower abilities to have the largest ranges. Although, KS3 Middle band does have an extremely high sample size, meaning there was more chance of having a higher range. Also, as before, range takes into account the extreme highs and lows of the data, but we can still say it is unusual that middle band had the highest ranges.
Standard deviation, on the other hand, conforms to the hypothesis much more. There is a clear pattern to see when all the standard deviations are shown:
This shows that as we go up in ability, standard deviation lowers and therefore consistency increases. Again, though, age (Key Stage) does not seem to affect consistency considerably.
However, to understand how accurate the estimates are from the standard deviation, we need to look at the mean. The means are probably the most surprising statistic in this set of data, as shown:
Here we can see that KS3 mostly corresponds with the hypothesis, as upper band have the mean closest to zero and lower and middle band are very close. It is KS4 lower that does not agree with the hypothesis at all. It is closest to zero by a long way, meaning on average they are the most accurate at estimating, although it does have a high standard deviation perhaps meaning more values are farther away from this mean. This means that in fact KS4 upper band’s values are closely bunched (due to standard deviation) around a value that is further away from zero % error and therefore less accurate than the lower band. Although the lowers band’s data is less consistent, it is less consistent around a value very close to zero, suggesting many pupils in KS4 lower band guessed very accurately, on a contrary to my hypothesis.
Looking at the median and the skew, it seems that KS4 lower band were indeed the best at estimating overall. They have a median of –1.36, whereas all of the other categories have a median of –4.76. Looking at its skew, it is negative, which means that most of the values were estimated between –1.36 and 2.04 % error, incredibly close to zero. Whereas all of the other categories have a positive skew, meaning the majority of the values are between –4.76 and –8.16, much farther away than that of KS4 lower band. This also suggests that generally students are more likely to guess lower than the true value, rather than higher.
Overall, the results do not particularly back up my hypothesis that the higher the ability, the better you are estimating. What is apparent is that as ability increases the spread of data decreases, making higher-level students more consistent. However, this does not make them more accurate. In fact, in terms of accuracy, there is little evidence to say that higher ability students are more likely to have a more accurate estimate. This is shown from the evidence of KS4 lower band, who seemed to be much more accurate at estimating even than the upper level KS4. It seems that, as of yet, it is hard to find a relationship between how good people are at estimating and their age. Ability does not seem to have a major effect, so other variables should be considered to help me come to an informed conclusion.
Investigating Hypothesis 3
I will now investigate my third and final investigation – boys are better at estimating than girls. After looking at age on its own and with ability, it has been difficult to find any sort of absolute connection between these categories. Hopefully I will be able to find some sort of relationship in gender. It is very problematic for me to come to a prediction for this hypothesis, as there is no way to tell beforehand how well boys will compare to girls at estimating angles. I would actually expect them to be almost the same in accuracy, with males perhaps just being slightly more accurate. I can also use these results to look deeper into my first hypothesis, as I will see how each gender’s estimating ability changes as they get older. This time I will be including Key Stage 5, as it does include both male and female students, and therefore I compare these as I would with the other Key Stages.
Results
This is how the results look in box plots for Key Stage and gender, with all of the key statistics shown around the sides:
Analysing the Data
Immediately, what is obvious here is that all of the box plots have the same semi inter-quartile range (5.1) and the same upper and lower quartiles (LQ=-8.16, UQ=2.04). This may seem unlikely, but after checking the data I am sure that the box plots are accurate. As we saw with the first investigation, it appears that, ignoring the highest and lowest values, age and gender do not have a great effect on how consistent the majority of the pupils are at estimating.
However, if we are to look at the ranges, we get a different picture, probably because this includes extreme high and low values. KS3 males clearly have a higher range than KS3 females, and the same applies to KS4 and KS5 respectively. This gives the impression that overall females are more consistent and precise in their estimates than males. Although we know from the semi inter-quartile range that this isn’t necessarily true, as I.Q.R is a better measure of consistency because it does not take into account extreme high and low values so could be effected by just one or two students (although we have already taken out any severe outliers).
Once more standard deviation shows the same pattern, that as age increases standard deviation increases.
But there is not much difference between males and females of the same Key Stage until KS5, when females are slightly more consistent, backing up the previous point.
Evidently, to understand how accurate the estimates are from the standard deviation, we need to look at the mean. Yet again the means show something that the spread cannot tell you:
Here it is clear that I was actually correct in my prediction that boys are better at estimating than girls, as the males are visibly closer to zero % error than the females. Again though there is no clear relationship between each Key Stage (and therefore age), in fact KS5 females are further from zero than KS4 females. Therefore it appears gender does not have an effect on how much improvement is made with age. What is apparent is that males seem to be better at estimating than females.
This point is also backed up by the skew of the box plots, especially with Key Stages 4 and 5. The males are negatively skewed; meaning most of the estimates were between the median (which was close to zero) and 2.04, giving exceptionally accurate results. Whereas the females were negatively skewed, meaning most of their estimates were between the median (further away from zero than the boys) and –8.16. Overall this would give the females considerably less accurate results.
Conclusion
In conclusion, it is obvious that there is no concrete evidence that we can take away from this analysis, other than males are perhaps slightly better at estimating than females. We have seen no clear relationship between age and accuracy of estimation, nor between the seemingly most obvious relationship between maths ability and accuracy of estimation. It seems likely that, estimating an angle is exactly that – estimating. It has nothing to do with maths ability or age, but apparently gender does have some effect. It is just educated guesses that, according to this data, males are slightly better at.
However, there were still many things that would have improved the investigation were we to repeat it. For example, the sample size for much of the data may have been too small, so wouldn’t have allowed us to see a trend in the data. Increasing the sample size would give a much better representation of the population. As Key Stage 5 had a much smaller sample size and are all only in upper band ability making it hard to compare them, so this makes me question whether we should have included them into our investigation at all. They chose to do maths and perhaps it is unfair that none of the other students have actually chosen to do maths. We could also have looked at year groups instead of Key Stage, as it would probably be easier to spot a trend if there were more categories to work from. Doing this would allow us to draw many more box plots to investigate in much further detail.