Maths Statistics Dice Investigation
Maths Statistics Coursework
Introduction: You are trying to make money by selling a game to friends. Each person pays a £1 for one throw of the dice. If they throw a 6 they win £10 - Investigate
2
3
4
5
6
4
5
7
6
8
0
From the table I can see that if I played the game for real I would be loosing more money than I was making. There would be a 1/6 chance of winning which means that for every £6 I made I would pay out £10.
To make the game more profitable I am going to design another one using one dice. The game is "You throw the dice and if you get a 1 you win £5"
Dice number
2
3
4
5
6
No' time thrown
9
8
8
9
9
7
From the table above it shows that if the game was played for real it would make a small profit of £5 for every £50 that came in. There is still a 1/6 chance of winning but the prize money has been reduces so that for every 6 pounds that I took I would be paying out £5 so I would statistically be making a profit of £1 for every 6 throws that took place
From the previous results that I received I think that ...
This is a preview of the whole essay
9
8
8
9
9
7
From the table above it shows that if the game was played for real it would make a small profit of £5 for every £50 that came in. There is still a 1/6 chance of winning but the prize money has been reduces so that for every 6 pounds that I took I would be paying out £5 so I would statistically be making a profit of £1 for every 6 throws that took place
From the previous results that I received I think that I should increase the amount of events that can take place. To do this I will need to have a extra throw or have another dice.
To try to make a even bigger profit with this game I am going to make a totally different game with two dice. You throw the first one and you have to get a higher one to win, you pay £2 a go and win £5 if you role a higher number
Win
5
Loose
75
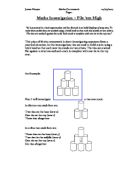
From this game you can see that you would make a profit testing the game showed that for every 100 goes you would make a profit of £75. To work out the probability for this you can draw a tree diagram
The probability for winning in that game is 15/36 this means that statically for every 36 players 15 of them would be winners. So for 36 plays you would take £72 of which £75 would be prize money. This shows that you should make a loss with the game but when it was tested a profit of £75 was. This happened because the game is based on luck it is not definite that 15 people in 36 would win.
To make a better game I think that there should be a game with the same amount of events but with less possible winners. I have decided on a game, which you pay £1 and if the numbers are consecutive you win £5. The second consecutive number has to be higher e.g. 1,2 would be a win but 2,1 wouldn't
Win
2
Loose
88
In this game you take £100 which £65 is prize money. To find out a probability of there being consecutive numbers you can draw a grid, which shows what the probability of getting consecutive numbers with two throws of the dice.
,1
,2
,3
,4
,5
,6
2,1
2,2
2,3
2,4
2,5
2,6
3,1
3,2
3,3
3,4
3,5
3,6
4,1
4,2
4,3
4,4
4,5
4,6
5,1
5,2
5,3
5,4
5,5
5,6
6,1
6,2
6,3
6,4
6,5
6,6
From the above table it shows that the probability of getting a consecutive number is 5/36, which means every 36 players 5 of them, would be winners. With the players paying £1 you would make £36 and pay out £25.
I found out that the last game I created the consecutive number would make the most money this happened when I was testing and statically it was correct. When testing it came out that I would make £35 out of every 100 games and statistically I would make £1 out of every 36 games.