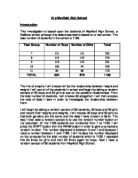
Extending the investigation
Now I am ready to extend this investigation, to do so I will make a hypothesis to test. This hypothesis can be true or false, and it is my investigation that will test it. My hypothesis for this investigation is: In general, the taller the person’s height is, the more they would weight. This hypothesis is made by looking at height and weight of the sample I will gather.
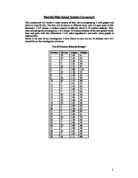
To do prove this, I will have to gather a new sample, I have done that below:
This is a sample of 30 boys and 30 girls, I have taken these at random by the process of a “lucky dip” way.
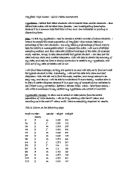
When gathering this mass amount of data, is it wise in the course of maths to find the mean, median, mode and range of the height and weight for the boys and girls. With this information I will make statements with it, and compare the information with the boys and the girls.
Here you can read straight away the mean, mode, median and range for the stated information.
The 4 measurements I have taken (mean, median and mode) show that they are almost or near to, greater then girls. The range the both the girls and the boys are the same, indicating a similar structure on both the girls and the boys. In conclusion, although the numbers suggests the same figure, overall, the boys are slightly bigger then the girls.
With that information I gathered and calculated, I have now complied the illustrated graphs to represent it. Again, this is an easy way to read off the information with convenience.
Here is the polygons graph which is very useful to compare the two sets of information together.
Averages
I have recorded the mean, median, mode and range, and because the data is continuous, its makes more sense to find out the modal class interval instead of the mode. The class interval that contains the most values is what is placed in the box below:
My three measurements is uncannily similar, this is maybe due to the environment they are brought up in, and the food they eat, there it shows that they are in similar size, and similar medians. A difference is the range which is 87 for boys, and 80 for the girls. The evidence shows that the boys vary in sizes, and this shows also with the girls also. The evidence shows that both sizes do have similar properties. I also must remember that this conclusion is based upon a sample of only 30 boys and 30 girls. If I was to peruse a more accurate investigation, I would choose a sample of 100 or 150 for a far more accurate conclusion, and this would help the investigation a lot.
Comparing height and weight
Here I will extend the investigation with my hypothesis before I stated:
In general, the taller the person’s height is, the more they would weight
To test this hypothesis we will carry on using my previous sample of 30 random students of mixed gender.
Here, there is a positive correlation between height and weight. This suggests that the taller the person is, the more they will weight.
With the line of best fit, you can make predictions on the person weight, and height.
Further investigation
Here I will test whether a better correlation will occur if we consider boys and girls separately in different graphs.
Here again the scatter diagram is a "up and down" effect causing the lines to become jagged. With the line of best fit, you can make guesses on the weight and height of the person in question.
Here as you can see there is an often up and down effect as the heights rises, causing the dotted line to become jagged. With the line of best fit, you can make guesses on the weight and height of the person in question.
This supports my hypothesis whereas the boys are more concentrated on the higher areas compared to the girls who are concentrated in the lower section of the height and weight.
Having now made those graphs, I see that the line of best fit is a good evaluation of the relationship between height and weight. There are anomalous results in here which falls outside the general trend, but these can be ruled out by the averages.
Cumulative frequency graphs
Cumulative frequency is a powerful tool when comparing data such as here we have. This table below shows the cumulative frequency for the height for boys and girls, and the mixed sample.
If I was to increase the sample size to say 100 boys and 100 girls, I would increase the accuracy of the cumulative frequency curve and further justify my statements.
The best way to represent this information to create cumulative frequency curves. If it was to be created on the same graph as below, comparing them is much easier for the eye.
The curves show clearly that the trend towards larger heights amongst girls and the boys. As you can see also, that there is a slight peak earlier in the girls then in the boys, this shows the height peaking is lower for the girls then the boys.
Here again you can see the weight in boys and girls, surprisingly, the girls seem to weight more then boys, which suggest girls overall weight more then boys.
Summarizing the results
It is important to analyse the data you receive, and interpret the outcomes and discuss the results and findings. Here I will place my thoughts on this investigation, and refer back on it with the graphs and the text:
- Now looking back, I see there is a positive correlation between height and weight, there are a few exceptions, but these can be averaged out. In general taller people weight more then smaller people do.
- The points on my scatter diagram for boys are less dispersed then to say the girls are, the boys are concentrated whereas the girl isn’t. This suggests that the correlation is better for boys then for the girls and boy’s height and weight is more predictable compared to the girls.
- When looking at the mixed scatter diagram, the points that are less dispersed then to the singular points, this suggests that when combined they form a better picture compared to separate scatter diagrams. This suggests that the correlation between height and weight is equal and is predictable, and would make a better picture when mixed together.
- The points on the mixed scatter diagram of boys and girls has a slight curve, suggesting that the points are not linear, but the range is predictable and isn’t a wild curve.
- My scatter diagrams I compiled can be used to give reasonable estimates of height and weight; you can get this information by just reading off the scatter points, or looking at the line of best fit on the graph.
- Cumulative curves show that girls peak earlier then boys, whereas boys peak the curve nearing the end of the curve. This suggests that boys are naturally taller then girls because of the shape of the curve of the boys and girls when comparing them.