Sampling
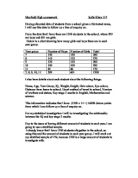
Year 7: Boys = 150/1200 × 60 = 7.5 ≈ 8 samples
Year 7: Girls = 150/1200 × 60 = 7.5 ≈ 8 samples
Year 8: Boys = 145/1200 × 60 = 7.25 ≈ 7 samples
Year 8: Girls = 125/1200 × 60 = 6.25 ≈ 6 samples
Year 9: Boys = 120/1200 × 60 = 6 samples
Year 9: Girls = 140/1200 × 60 = 7 samples
Year 10: Boys = 100/1200 × 60 = 5 samples
Year 10: Girls = 100/1200 × 60 = 5 samples
Year 11: Boys = 84/1200 × 60 = 4.2 ≈ 4 samples
Year 11: Girls = 86/1200 × 60 = 4.3 ≈ 4 samples
Sample: 8+8+7+6+6+7+5+5+4+4= 60 samples in total
Stratified Sampling
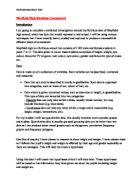
A random number can be chosen by a calculator by pressing “SHIFT” then “RAN#”. I used this method to choose pupils for my samples. Firstly, I split each year group into boys and girls, and then numbered every pupil within these groups. Then I used my calculator to press “RAN#” multiplied by the total number of people in a group, and rounded the number to the nearest whole number, e.g. RAN# x 58 = 13.166 ≈ 13, therefore I choose pupil number 13, who is Jennifer Dodman, for sampling in my group of Year 7 girls, noting down her height and weight in my tables. Then I repeat the same method a further seven times to get a total of 8 pupils for sampling, noting down their heights and weights. If I get a number I already have, I just repeat the method again to get a different one.
Hypothesis 1: Are boys taller than girls?
Before investigation: I think that generally, boys will be taller than girls, because of the general physical differences between them. However, from Year 7, girls will probably tend to be slightly taller than boys at first, because they usually start puberty slightly earlier.
Frequency tables:
Boys’ heights (cm)
Mean = (49.1÷30) = 1.6 =
Range:
Range of height = highest height – lowest height
The lowest height sampled is 1.20cm.
The highest height sampled is 1.90cm.
1.90 – 1.20 = 70
Therefore, the range is 70cm
Girls’ heights (cm)
Mean = (47.6÷30) = 1.6 =
Range:
Range of height = highest height – lowest height
The lowest height sampled is 1.19cm.
The highest height sampled is 1.80cm.
1.80 – 1.19 = 61
Therefore, the range is 61cm
Frequency graph and box plots for height
After investigation: Looking at the height CF line graph alone, girls tend to be a little taller than boys. However, the box plots show the boys are the ones who are slightly taller, both ranges being equal but the boys’ box plot is more places to the right than the girls’. This is because the highest boys’ height is more than the highest girls’ height, and vice versa for the lowest heights.
Hypothesis 2: Are boys heavier than girls?
Before investigation: I think that boys will tend to be heavier than girls because of their muscle mass. Also, usually the taller you are, the heavier you are, and I have already predicted that boys are taller than girls.
Frequency tables:
Boys’ weights (kg)
Mean = (1680÷30) = 56 =
Range:
Range of weight = highest weight – lowest weight
The lowest weight sampled is 35kg.
The highest weight sampled is 80kg.
80 – 35 = 45
Therefore, the range is 45kg
Girls’ weights (kg)
Mean = (1440÷30) = 48 =
Range:
Range of weight = highest weight – lowest weight
The lowest weight sampled is 33kg.
The highest weight sampled is 72kg.
72 – 33 = 39
Therefore, the range is 39kg
Frequency graph and box plots for weight
After investigation: Looking at my weight CF graph, I can see that girls are also a bit heavier than boys. However, the box plots show a larger range and median for the boys that for the girls.
Pilot Study
I have included a pilot study of all the sample data I have collected, to level out any difficulties or problems, such as absent or anomalous data. I made a scatter graph of the sample heights and weights, to investigate whether there is a relationship between the two. I drew two lines of best fit, one for the girls and one for the boys. The graph is on a separate sheet of graph paper.
Looking at my graph, I can see that there is some relationship between height and weight, as all the results are grouped quite close together. I can see that they do not all fit exactly on the lines of best fit, simply because of the physical variations between different people, e.g. some people are overweight for their height, and some are underweight for their height, etc.
Conclusion
After carrying out both investigations, I have come to the following conclusions for each hypothesis:
For hypothesis 1, I had expected boys to be taller than girls, and my box plots do agree with this as boys have a taller range. However, according to the height CF line graph, it is girls that tend to be taller. I could improve the accuracy of my data by repeating the investigation and taking more samples.
For hypothesis 2, I predicted that since boys are probably taller than girls, they would be heavier as well. My box plots do show that boys have a bigger range of weight, but it is girls that are heavier in the CF line graph. I could improve the accurateness of this investigation by doing it again and taking more samples.
From this coursework, I have learned how use random and stratified sampling in an investigation to find out averages and ranges. Also, I have learned how to apply these sampling methods to a weight and height investigation. Furthermore, I have found that CF line graphs and box plots do not always agree with the highest value.