Secondly I will need to stratify the data for my sample making it proportinate to the size of the year. By doing it this way the number of pupils I pick from each year groups will in proportio to the total number in each year group. After I have done that I will decide on a sample size for each year group making sure that I keep the sample for each year group the same.
Next I will sample the data picking students who I will use to prove my hypothesis making sure that it is done in a fair method. After that I will put the data in a table for each year group showing height and weight results. Futhermore I will add columns to show frequency, mid point and total height/weight. I will use this information to work out the estimated means and the modal groups.
Once I have done that I will draw cumulative frequncey graphs to find out and show the median and inter-quratile range of height and weight for each year group. I will also include box plots in the graphs.
Then I will draw a graph to show the correlation between height and weight of all the students I have chosen to sample. Finally I will make a comparison table to show the differences between the height and weight for each year. To end I will make comments on the validity of the results I have obtained.
Hypothesis 2 plan:
Using the sample I collected from doing hypothesis one, I will separate the sample into male and female. I shall use that information to prove my second hypothesis of girls in years 7, 8 and 9 are taller and heavier but boys in years 10 and 11 are taller and heavier.
Then like I did for my first hypothesis I will make tables showing frequency, mid point and total height/weight. I will this information to find the estimated mean height and weight. Also I can use it to find the modal group. There will be four tables for each year groups a there will be a two table of height and weight for the two genders.
Next I will draw cumulative frequncey graphs to find out and show the median and inter-quratile range of height and weight for both male and female in each year group. I will also include box plots in the graphs.
Once that is done I will make a comparison table to show the differences between the height and weight for girls and boys in each year. To end I will make comments on the validity of the results I have obtained and see if my hypothesis were right or wrong.
Sampling:
There are various types of sampling you can use to collect data. The most commonly used ones are random and stratified. In order to collect my data I used a stratified sample. Stratified sampling involves dividing the population (in this case the number of students) into groups called strata. From each stratum (plural) you can
choose a random or systematic sample so that the sample size is proportional to the size of the groups in the population as a whole. For example:
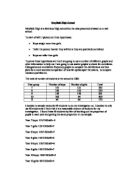
The raw data contains 1118 pupils in Mayfield. This population is too much for my investigation so I divided them into different year groups. These year groups are my stratum. Then I sampled them so that the size is proportional to the size of the whole number of pupils in the school. I think that a fair sample size was 10 percent for each year group. By making the sample size in proportion to the number of pupils in each year group the investigation will become fair. E.g.: There are 283 pupils in year seven. If I take 10 percent from year 7 it will equal 28(to 2s.f). These are the number of pupils I will sample for that year group. I will be keeping the sample size in proportion to the number of pupils in year seven by using this method. This method is the best way of picking a smaller sample and keeps it fair. The table below shows the number of students I will sample for each year. They are all taken by finding 10% of the number of pupils in each year group.
Then I did a selective sample which gave me the pupils who are going to be included in my investigation. Selective sampling is when you choose a small number of pupils in from the large proportion.
There are 282 pupils in year seven and I had to choose only 28 in total as that is 10 percent of 282. So in order for me to pick these 28 students I had to use selective sampling. I picked a random number between 10 and 20. The number was 16. So I went to the table with the data of Mayfield high school and counted down sixteen rows. The person who was on this row became my first sample. Then I counted down another sixteen rows and noted down my second sample. I carried on till I reached the end of the last row but I did not have 28 pupils so I went back to the start and counted till I got 28 pupils. One thing I did was that if I was on a middle of a count and reached the last row I would start from the start with that number I was on. E.g.: if on 12 I reached the last row I would go back to the start and begin again from 12. On my second round I did not count a number for the pupils who were already my sample.
I did this with the rest of the years and picked pupils who were on every sixteenth row but only got the number of pupils I required. Year 8 = 27, year 9 = 26, year 10 = 20 and year 11 = 17. Once this was done I had all my samples and was ready to put them on tables.