Ahsan Malik
Maths Coursework
In this investigation I have been given data on Students from Mayfield High School, each student has a vast amount of data about them
I have decided to make my hypothesis: The distance a student lives from the school determines they method of travel they use to get to school.
I have taken out all irrelevant data from my database and left the Age, distance from school and means of travel for each student in the database.
For Key Stage 3 and Key Stage 4 I used a random method to cut down the amount of students for each means of travel this was done so it would make it easier for me to carry out the investigation.
I will be using a random sampling method to cut down the data as I will not be able to compare every student.
There are many ways that I could use to get my random data, Stratified sampling is one method, it is where a person is placed into a group, then random samples are taken from each group. Another method is systematic sampling which is where you can go and pick out every 10th or so person.
I did not use either of those above to sample my data instead I used random sampling, this is where every data has a chance of being chosen, examples of this is using the “ran” button on a calculator and multiplying by 10 or 100. Then I combined my results from KS3 and KS4 for each type of travel.
I will be using cumulative frequency, this will help me get the lower quartile, upper quartile, inter-quartile range and median. Then I will be able to use this information to create box plots. The box plots will help me to compare my data.
I will also be using standard deviation. Standard deviation is a method used to find out the variation of a sample. This will help me find out which type of travel has the most spread out data and which does not.
Means of Travel: Bike
.
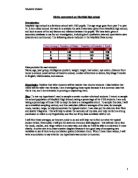
The results of travelling by bike show that, as the distance gets up to 2.99km a total of 15 students travel to school by bike, as the distance from there increases the amount of students travelling to school by bike decreases. Only 6 students travel to school by bike between the distance of 3km and 8.99km
used 1≤d<1.5 and 1.5≤d<2 because if I had just used 1≤d<2, I would have not been able to get a lower quartile as it would have been lower than the lowest point. After doing this adjustment the lower quartile is 1.6Km, the median is 2.3Km the Upper Quartile is 4.1Km and the Inter-quartile Range is 2.5Km.