There are too many pupils to employ all the results so I'll use a sample of the boys and a sample of the girls. In order to make comparison easier I will use the same number of boys as girls in my two samples. Also to try to avoid BIAS I will use Random Stratified Sampling which will make sure that each year group is equally represented.
Stratified sample of the weight
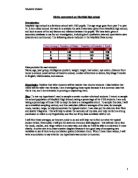
This table shows how many boys and girls there are in each year group. I have decided to use 52 boys and 52 girls. I'll will then take 13 in the upper quartile of each sex which will give me the 26 heaviest boys and girls. That should be enough to represent KS4 without being too many to work out.
Initially, I must decide how many boys and girls to use in each year group; the total figure of boys that I'm going to use is 52 as well as the girls.
Example
The stratified sample of year 11 boys would be 84/190 * 52: The number of boys in year 11 divided by the total number of boys in the whole of KS4 multiplied by the size of the sample that I want which is 52.
Now, I'm going to choose the students that I'm going to include in my sample.
Boys
Firstly, I have to find a random sample of 29 boys in year 10. To ensure my data is fair (unbiased) and representative of all boys in year 10 I'll give each boy in year 10 a number starting at 001 and finishing at 106 in year 10.
For year 10 I'm going to use a scientific calculator which is programmed to give me 3 digit numbers up to 106. I will use all the numbers to the left of the decimal place to select students (I will discard all the numbers after the decimal points and use only the ones before it). Then I stop when 29 have been chosen. For the boys in year 11, the calculator will be programmed so that the numbers are from 001-084, I will then choose the first 23 students that come up, and this ensures the selection is random.
I repeated this process for the girls in year 10 and 11, but each time I changed the number my scientific calculator could go up to, e.g. for girls in year 11 my maximum number would become 86, because there is only 86 girls in year 11.
Once I had my Stratified random sample of 52 boys and 52 girls in KS4. I needed to find the heaviest boys and girls in my samples. So, I decided to plot my weights into a cumulative frequency in order to determine the median! Here are my cumulative frequency tables:
Boys
Girls
On my cumulative frequency graphs you can see that my median for boys is 50 kg and for the girls its 60 kg. however I noted that in a cumulative frequency graph data is lost because we start to group information together, someone who is 51 kg would be in the 50 < x ≤ 60. So, we wouldn't know their exact weight. In order for a more precise and accurate estimation of the median I will do a stem and leaf diagram and box plots for both of the 52 random samples. A stem and leaf diagram would be more accurate because unlike the cumulative frequency graph we don't group
everything so no information is lost. Here are the 2 stem and leaf diagram (in order)
Boys in KS4
Lowest value= 35
Lower quartile= 50
Median= 60
Upper quartile= 66
Girls in KS4
Lowest value= 38
Lower quartile= 47
Median= 51
Upper quartile= 56
Conclusion
My findings have proven that my hypothesis was actually correct which was “boys are heavier than girls". I compared both median for girls and for boys, I found out that the median for girls is actually 10 kg less than the boy’s median which was 60 kg and for the girls: 60-10= 50 kg.
My box plots have also shown that, the weights of the boys are more spread than girls. So, this also proves that boys are heavier than girls