There is an error in the yellow box data because it is not possible to have an IQ that is 14, so I will count as an error. This might because when they are doing the data collection, they might input the wrong data. And it might because of the questionnaire confuse him, causing him input the wrong answer. I believe that all the other data is right, because those it come from the exam board.
There is also a way to show data. Such as “Stem and Leaf Diagram”. I am going to do IQ for all those 50 data.
This is a good way to show data, because that will not have a big and long list and we can store or find a data fast and easy.
Investigate Hypothesis 1First I am going investigate what do the got in KS2 and IQ by using a line graph.
All the data have been analysis by using the stratified data.
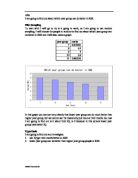
This a graph that showing what marks did them got in 50 of those people. They are evenly spread out and more people likely to score high marks.
When I was doing this diagram it has an error that I have not put in the diagram.
This seems to have more different then the one I just did, there have higher interquartile range than the KS2 result. I think that is because that IQ have 60 -139, but KS2 just have 1-8. That might have cost the problem.
Cumulative frequency graph I will also be able to know the median, interquartile range, upper quartile and lower quartile.
- To calculate median is the total cumulative frequencies add 1 then divide by 2.
-
To calculate interquartile range is using the maximum – the minimum.
- To calculate upper quartile is using the maximum number time 1/4
- To calculate higher quartile is using the minimum number time 3/4
Conclusion
As my conclusion say that “IQ might be able to have get their results better on KS2” better, in the graphs look so similar it might have some connection, so I will combine the two data together to see can IQ get KS2 better.
If I need combine I can not need to use the average because line graph will not work and I will need to use scatter diagram. I will be using all the data from the data pages.
But there is error that I have count in so it should need to remake. From the diagram you can see that the IQ does not really has relation with KS2, but to be sure I am going to do one more to prove that is it right or not. By combining year 7-9 with 10 and 11, to give me a larger different scale of different.
Although I have took the error out the graph still got problem. It might because of the amount of the data is uneven. So that is also the reason why I going to use combining year 7-9 with 10 and 11, to give me a larger different scale of different. And I can also use that to compare.
From combining them you can see that year 10-11 have longer best fit line because there a person who has less than 20 IQ which count as error, so I should have remake it. But other than that the data seem like have not got any relation at all, but two of diagrams you can see that it have not got that big interquartile range. So if I have take that error away it will just change the best fit line so I will not bother at it, because it will not change my results.
Conclusion
We can see the best fit line is going, so I think that if you marks are high the high the IQ you will have. That prove my Hypothesis is correct.
The reason why I cannot see that in all the data, because that there are people who have a different so it cause the average pulled down, but if I just use two group I will be able to see the differences.
Using the equation of the best fit line, I will be able to predict what mark or IQ by using one of them. Such as he is IQ 98 for year 10, so I will use the equation of year 10-11. First I will need to put the value in to x, but only IQ because y is for the value of mark. y=0.0018 x (98) + 3.7834. It will be 3.9598.
Investigate Hypothesis 2
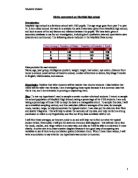
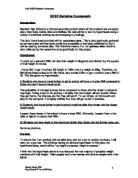
Now I am going to investigate “lower year group can do better than higher year group people in KS2”. I predict that it will have relation because that from the Pilot Sampling’s graph show me that I have relation in bar graph it show lower year graph have higher marks than higher year. So I think that this hypothesis does have relation.
First thing I will need to do is do the same thing as the bar graph to see is there are a different between pilot sampling and stratified sampling.
But unfortunately I might be wrong. It is different to the Pilot Sampling. Lower year group have done better than higher year group. So I am going do some more graph to prove it
I have use all the people’s data too show the whole of the year group data. The data is analysis by the main data sheet
From that box-and-whisker plots graph I can tell the all the information now, such as the mean, median, interquartile range, upper quartile, lower quartile and standard deviation. The actually mean this:
Mean is the average of the year group. It can tell what mark they got in average, if the number is high meaning that the whole year group is doing well. Such as year 11 has highest mark then other year group and year 7 did the worst.
For median, we will able to tell the meddle person’s mark so we will able to know, so we can tell how well can they do. It is just like mean but it is for individual.
Interquartile range can tell use that how spreads their marks. If the number is big that mean the spread is high and their marks different, like the top and the bottom have a big different
Lower quartile is about the first quarter of the year group, what first quarter of the year group gets in average. It can tell what do the bottom marks in the year group get. Upper quartile is about the third quarter of the year group, what they get in average. They can tell me how much different do the top and the bottom. It can tell what the top mark is.
Standard deviation is about what is the spread of the whole year group so I can tell what is the different for each person.
Year 7
This is the example to do standard deviation, by using that formula.
Conclusion
From the graph we can see that young people cannot get lower marks than old people. But on the other hand I find out in the box-and-whisker plots we can see that the younger year group have a large different in their mark as well, meaning that the highest mark and the lowest mark people have a large different we can tell by interquartile range, standard deviation and mean. To see it easier we can look at the box-and-whisker plots, the longer the box, the larger the different. In higher year group can tell very easily the different of the year group is very low. The evidence is it standard deviation it is very low.
Evaluation
Investigate Hypothesis 1
I found out that higher IQ can get you better KS2 results. By drawing Cumulative frequency graphs that I can know their median, interquartile range, upper quartile and lower quartile. I can also use the best fit line to find the values in the scatter graph, to predict or calculate the figure that I need.
Investigate Hypothesis 2
I found out lower year group might not get higher mark than higher year group, meaning that my hypothesis is wrong. I found out that from bar graph and box-and-whisker plots graph. The higher year group have higher mark than lower year group. If we look at that bar graph, year 11 had the highest mark and the year7 had the lowest marks, but by the box-and-whisker plots graph, we can see that year 10 had the less spread by use the standard deviation.
There is some problem with this stratified sampling because it might have too few people on each year. But if I use random sampling I would have equal people on each year, but it will not have an advantage like stratified sampling which is ratio. That can equally find their ratio, because that till be fair to other group of data. Some have less people than other
All those conclusions above might not be right because I am just take samples. To increase the accuracy, I will need to use more people. “The more the people, the more accurate it is.” That mean I will need to use the more data to do it, and I will be able to predict the unknown things better and accurate. There are also a way, is I can create a questionnaire to get my only primary data, because those data is secondary.