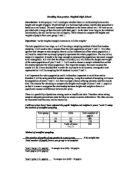
Back-to-back stem plot
To make it easier to draw the stem and leaf diagram I sorted the data on the computer so that the IQ was in ascending order. The stem and leaf diagram shows that the IQ of males and females are very similar because the diagram is more or less symmetrical. It also shows that the IQ of males is slightly higher than the females. The males are quite close together with the exception of one low IQ and one high IQ. Both females and males have the most students in the range of 100-104.
Frequency Polygons
Below is a frequency polygon showing the IQ of the whole of my sample (males and females)
The frequency polygon below is showing the males and females IQ separately. From the diagram I can conclude that the IQ of males and females are very similar. The peaks of IQ are exactly the same at a frequency of 22
Averages
I worked out the mean average using the formula:
Mean = sum of the IQ/number of students
Mean average of females: 102.162
Mean average of males: 103.211
The mean average IQ for males is slightly higher than the mean average IQ for females, this gives evidence to support my hypothesis that males have a higher IQ than females. Looking at the female stem plot there was one particularly high female IQ, this would have made the difference smaller. There was also a high male IQ but a low male IQ cancelled this out.
The median is found by putting the IQ numbers in order then finding the middle number.
The median average for females is 102
The median average for males is 101.5
These two medians are very similar so it does not prove much. Although the median can sometimes be a better average because it does not take into account the extreme values but in this case it wouldn’t make much difference
The mode is the IQ number that appears the most.
The mode of the females and the males is exactly the same (100) so not much can be concluded from this.
This average is probably not as useful and accurate because it can give a distorted average.
Spread
The range of the female IQ is 37 and the range of the male IQ is 44. This shows, by a simple method, that the males have a larger spread than females.
The standard deviation can be found by using the following formula:
σ2 = ∑ (x – x)2
n
σ = standard deviation
∑ = sum of
x = mean
x = data value
Instead of going through every single data value in my sample doing this calculation I used excel to create another column that calculated (x – x)2. Also using excel I found the sum of that column, then divided it by the number of students. This gave the variance, to find the standard deviation I had to find the square route of the variance.
To check that my answer was correct I found the standard deviation using formula wizard on excel.
The standard deviation for the female IQ is: 7.73 (to 3 significant figures)
The standard deviation for the male IQ is: 8.04 (to 3 significant figures)
Standard deviation is another measure of spread, so the range can be backed up. Males have a larger spread than females.
The interquartile range for both males and females is 9. This means that although the above two methods of spread have shown that the male IQ spread is bigger it is still very close and the spread is similar.
Box Plots
The two box plots are quite similar. The main difference is the range of the male box plot is larger. They are both slightly positively skewed but male data is more positively skewed. The second quartile is on both box plots are small but more so on the male box plot.
Cumulative Frequency
Below is a graph to show the cumulative frequency of both males and females:
The cumulative frequency graphs are also very similar particularly in the middle section. It shows that there are more females with lower IQ and fewer females with higher IQ. This diagram shows the spread of the data, which is about the same.
Conclusion:
My investigation gives evidence to support that males from years 9-11 have a slightly higher IQ than females from years 9-11. Although the data that I have shows that the two are very similar. If I had more data from a wider range of people I may be able to come to a stronger conclusion.