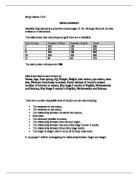
In this project we will take a random sample of 30 people from the school register. We will then draw graphs and compare the boy’s height with the girls and the boy’s weight with the girl’s weight. There are two different ways in which you can collect the random sample. Firstly you can use the RAN# button on a calculator. This method involves getting a random sample from the calculator and multiplying that number by 1200. Then I will have to do that 30 times and record each number down. The number that comes up after I multiplied by 1200 will be the person whose information I will take. For example, the number 0.252 comes up on the calculator. If I multiply that number by 1200 I will get 302.4. Then I will round the number up and I will get 302. That means I must take the 302nd student information down.
Secondly I can divide 1200 by the random number and whatever comes up use. That number to get the students information. For example, 1200 divided by 25 equals 48. That means I will take the information of every 48th students.
I chose to use the first method because firstly it is easier to do and less complicated and secondly it is more accurate. It is more accurate because I could not take information from the end of the data if I use the calculator method but if use this method the students will be more spread out. Below is the data I collected by using this method:
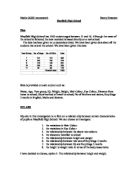
Below are two frequency graphs to present the data of height and weight of all 25 students. With this table you will be able to see the height and weight better and it will be easier to make any comments about it.
I will now construct a bar chart for the height and weight frequency that is shown above in my tally chart.
Now I will construct a bar chart for the weight.
I will now separate my frequency tables for height and weight. One will be for the boys and the other will be for the girls.
Now I will make a tally chart for the weight.
Now I will record my tally charts into bar charts.
Now I will make a bar chart for the height in girls.
Now I will do a dual bar chart and compare both girls height with the height of boys.
Here are my weight bar charts.
Now I am going to find the mean, mode and range of both weight and height. I am going to find these things individually. This gives a bit more information about the data and how spread out the weights and heights are.
- Mean for boys of height is 1.64m.
- Mean for boys of weight is 54kg.
- Mean for girls of weight is 52kg.
- Mean for girls of height is 1.57m.
- Mode of weight is 40kg to 49kg.
- Mode of height is 1.60 to 1.69m.
- Range of weight for boys is 37kg.
- Range of height for boys is 0.55m.
- Range of weight for girls is 27kg.
- Range of height for girls is 0.49m.
Below is a table to show the information I have found out by doing the above. This will make it easier to compare the weight and the height with each other.
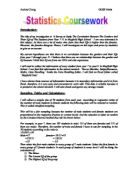
I have collected new data for each gender. I have found out that the relationship for the boys side has changed a bit. For example, one person is 170cm tall but weighs 49kg while a person who is 7cm shorter than him weighs 59kg which is 10kg less. The majority of the student’s weight and height doesn’t stick to this relationship.
From the table above I can say that all three measures of average, the mean, median and the mode are greater for boys than for girls. The range is also greater for boys than for the girls. In conclusion, although there are a small number of boys that are short in height and weight and girls that are tall in height and large in weight, the evidence suggests that, in general the height and weight for the boys are greater than the height and weight for the girls.
The relationship has also changed for the girl’s weight and height. For example, one girl is 183cm tall and weighs 67kg while another girl is 21cm tall but weighs 20 kg heavier. Also the majority of the student’s weight and height doesn’t stick to this relationship.
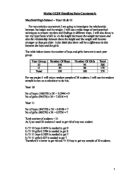
I am now going to show you two scatter graphs. One will hold data of the boy’s weight and height and the other will hold data of the girl’s height and weight.
The formula for to find out the equation to this graph is Y = Mx + C. The equation for this graph is y = 3.2x + 60.
Now I will do scatter graph to show the relationship between the girls height and girls weight.
The equation for this graph is y = 2.8x + 62.
Now I will do a scatter graph for the boy’s weight and girl’s height in a mixed population graph.
The equation for this graph is y = 2.9x + 44.
The line of best fit can tell me an estimate about somebody. For example if a boy is 140 cm then he will weigh about 45 kg.