Before I explain how I went about using this sample to try to discover correlation between my two chosen factors, I think it
necessary to state what outcome I think I will find after putting this information into graph-form and analysing it. I think I will definitely find a certain amount of correlation, but that the relationship will not be very strong. I think I will have to carry on looking into this in more depths in order to find a distinct relationship between pupils’ height and weight.
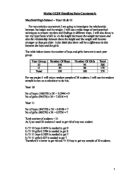
Firstly I decided to make some tally charts to analyse the data about the weights of the pupils, I then put this into a bar chart for easier viewing.
This chart shows that the modal weight is between 45-49, and from looking at my random mixed sample data, is it clear to see that from this range of numbers, 45kg is the most common.
I also worked out, that the mean weight of the pupil’s in this sample rounds down to 51kg. I worked this out by adding up all the weights then dividing the total by 50, the number of pupils. Also I found, by sorting the weights into ascending order, and finding the 25th weight, that the median is 49kg.
Using tally charts I also decided I would work out the mean, mode and median of the heights of the pupils using the same strategies. These turned out to be:
mean=1.5892 m
modes were 1.55m and 1.58m with 4 each. (1.6m to 2significant figures or 156.5 as the number inbetween)
median =1.58m
I also changed the tally chart into a bar chart, using grouped frequencies.
……ranges?
Also using this sample I also decided to plot a scatter graph, to see if there was an overall correlation between height and weight. Firstly, I used Data Sort on Excel to arrange my information starting with the lowest height, and working up to the highest, so that when I plotted my graph, it would be in the correct order to see if there was any correlation.
Here is my scatter graph;
The circled crosses represent data, which occurred twice, for example:
From this scatter graph it seems that there is quite poor correlation, but definitely some, as roughly the crosses do go from left to right, bottom to top. However,
it seems that this random mixed sample is not the best way to work out the relationship between the height and weight of the pupils in Mayfield High.
To try and see why this did not work out the amount of male/female pupils, and the number of pupils from each year within my sample to check its correspondence with the data on a whole.
This means my random sample does not reflect the true data of the school, as there should be more boys than girls, whereas in my sample, it is the other way round. Also the amounts from each year have similar faults, for example in the school there are less pupils in year 9 than in year 8, but in my sample there are a lot more pupils from year 9 that from year 8, making my sample incorrect in analysing the height/weight relationship of the whole school.
Therefore rather than continuing to work on this data, I will try to come across these limitations by splitting the Mayfield High information into categories which will enable a fairer, truer look at the correlation between height and weight.
So seeing as there was basically no correlation when I took a random sample of the whole year, I will now split the genders, to see if there is higher correlation. To do this I will need to get two new samples, one of boys and one of girls. I think that this will show a stronger relationship between height and weight than before, however I think there will be a big
difference between the results I get for the girls, and that I get for the boys.
Samples:
This is my female random sample. In order to collect this data, I sorted the original information into descending order which then meant that all the females where at the top, and the male- at the bottom of the worksheet. I then used the random number generating equation
=INT(RAND()*(1183-1)+1)
again in order to select the pupils I would use. However this time it was more difficult, and more time consuming because a lot of the numbers generated did not belong to female pupils. I tried to think of a way to get around this, but when I tried, it involved only sorting the data by the gender column and not expand this change to the rest of the data. This meant I could use the formula =INT(RAND()*(579-1)), in order to only generate females, however I ended up with the data of males just under the female category, which would seriously mix up my investigation into separate gender height/weight correlation because I wouldn’t really have separated the genders at all. For example:
If I hadn’t of checked that this separation worked, I would have ended up using data such as this, which is really supposed to belong to my male sample. Therefore, I simply had to go through it all the long way, to make sure my data was correct.
I have decided to analyse this data like I did before, in order to see whether, like I assumed in my hypothesis, there is stronger correlation now between height and weight because I have made this gender split. In order to do this I will hopefully work out the mean, median, mode and ranges of this data and plot some graphs, to try and find out the relationship between height and weight.
MEAN, MEDIAN AND MODE.
After analysing the female data I plan to do the same for the male, so I can see if there is much similarity between the two. I am hoping that there will be noticeable difference between the two genders, in order for there to show some sign of a difference when I plot some graphs based on my male/ female samples to see if separating the two causes more correlation to become apparent.