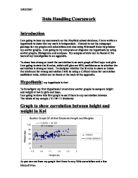
Graph to show correlation between height and weight in yr 10 males
The graph shows that there is no obvious correlation between height and weight in yr10 males. There are a few anomalies which suggests, that there could be an error in some of the data for the boys, For example there is a boy that weighs 9kg but is 1.60m tall! (we know that this is impossible). The r value I got for this graph is 0.293(3.sf) which again is weak correlation as the minimum r value for strong correlation is 0.336.
I have found that the R value for the height and weight of ks4 boys is 0.268. This shows that the correlation is not very strong because the minimum R value to show it has strong correlation is 0.336.
I am now going to do the same for the yr 10 girls as I have for boys. This will allow me to compare the correlation between height and weight in this year group.
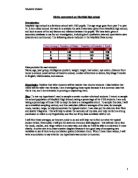
Scatter Graph comparing height and weight of yr 10 Females
This graph shows that the correlation between height and weight in girls is also inconsistent like the boys in yr 10. I added a trend line just so I can compare my results at the end, otherwise I wouldn’t have bothered as the correlation is very weak. Hopefully the Yr11 students will produce stronger correlation.
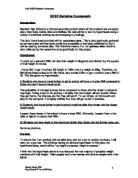
Scatter Graph comparing height and weight of yr 11 Males
This is much a better result than my previous scatter graphs! I can obviously see that there is much stronger correlation and received an r value of 0.763(3s.f) which is much higher and shows there is much stronger correlation.
Scatter Graph comparing height and weight of yr 11 Females
The r value for this graph is 0.556(3.s.f) Which shows that there is still some strong correlation but not quite as strong as the yr 11 males. I have found that the yr11 students have much more correlation than the yr 10 students mainly because the yr 10 students could still be growing whereas the yr 11’s will have started to slow down and stay that size.
Analysis of Ks4 Scatter Graphs
In my investigation I have established that in ks4 students there is stronger positive correlation in the yr 11 students than the yr 10s’. There is also stronger correlation in the boys than in the girls which follows my hypothesis. I will now draw some histograms to see if I can investigate further into my hypothesis.
Final Analysis
I think that my investigation has gone very well because I have proved my Hypothesis. Although the investigation went well I also think there were some limitations to it as well. I think that because my hypothesis were very direct and aimed at a particular theme there was not much room to move from the one topic. The only variation I had was to investigate the difference in height and weight in boys and girl in yr 11 but I could have investigated the heights and weights of students in years 7, 8 and 9. If I had the chance I would add a second hypothesis so I could have carried out more investigations and have a much larger project.
If I were to improve my investigation I would maybe do the same investigation but as I said to compare the height and weight of students in ks3, or maybe students in a different school. This would give me more variation in the data of which I could take my samples.
Despite not having enough variation in my hypotheses I did not have any problems. This was of great help because it allowed me to concentrate on other aspects of the investigation.
In my investigation I used the R value which allowed me to give very accurate analyses of the correlation on each of my scatter graphs.
I think my investigation has been successful because I have proven my hypothesis.
Appendix
Yr 10 boy’s heights and weights sample
Yr 10 Girls heights and weights sample
Yr 11 Boys Height and Weight Sample
Yr 11 Girls Height and Weight Sample
16 year olds Histogram sample