My mixed sample of students in Year 8
My sample of male students in Year 8
My sample of female students in Year 8
My mixed sample of students in Year 10
My sample of male students in Year 10
My sample of female students in Year 10
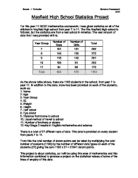
I have worked out the total KS2 result of each student as this was not included in the set of data that I was given. I have also included the mean, median, lower quartile and upper quartile in this data and I have rounded all values to 2 decimal places. I have deleted all of the data that is not relevant to my line of enquiry. For example I was provided with the height and weight of the students but as this was not going to help my investigation in any way I decided to delete that information
I have chosen to use Microsoft Excel to work out the mean, median, lower quartile and upper quartile values because firstly it saves time and it will be more reliable than doing the work by hand as it rules out human error. This means that I will not have to draw cumulative frequency graphs for each set of data but I may still draw a cumulative frequency graph if I think that it will enable me to present evidence to accept or reject my hypotheses in a more effective way.
I am now going to use the data that I have collected to prove or disprove my different hypotheses. My first hypothesis is ‘Students with high IQ scores will also have high Key Stage 2 results’. I am now going to draw scatter diagrams of my mixed samples of year 8 and 10 students. The data that I will use to draw the scatter diagrams will be the ‘Total KS2 Result’ and the ‘IQ’ scores.
This is a scatter graph showing the relationship between IQ and KS2 Results. This particular graph is showing my mixed sample of Year 8 students. This scatter graph shows a linear relationship. The graph is showing a very strong positive correlation which means that at least in this sample alone high IQ scores will also lead to high KS2 results. If I was able to draw a line of best fit on Microsoft Excel then I would be able to show you that the vast majority of data is clustered closely around this line. There is in this graph an anomalous result and it is glaringly obvious. One of the students included in my sample, Faheem Phil has an IQ of just 11 and his total KS2 results add up to 15. I believe that an error in the recording of this information may have been the result of this alarmingly low score as it is virtually impossible to score so low in an IQ test. I will omit the data for this particular student in any further graphs or diagrams that I use. It was my failure to spot this particular anomalous result that allowed this data to be used in the graph.
This is a scatter graph showing the relationship between IQ and KS2 Results. This particular graph is showing my mixed sample of Year 10 students. This graph shows a linear relationship. This graph also shows very strong positive correlation which means that if a student has high KS2 results they will also have high IQ scores. I cannot state for certain whether I accept or reject my first hypothesis but with both my scatter graphs showing strong positive correlation it is increasingly more likely that I will accept my first hypothesis.
I am now going to concentrate on my second hypothesis which is ‘Girls will have higher IQ scores than boys’. I will first look at the average IQ scores for males and females in years 8 and 10.
Year 8
From my sample I can see that there is very little difference between the average IQ score for the males and the females in year 8. Although there is a slightly higher average IQ score for the females in year 8 I cannot state that I accept my hypothesis as the results are too close.
Year 10
The mean IQ scores for year 10 students show that the females in year 10 have higher IQ scores than the males. The national average IQ score is 100 and the female students fall above that margin however the male students are below that margin. I can see from the average IQ scores that in both years females are achieving slightly higher IQ scores than males.
The line graph above is showing the IQ scores of the males and the females in year 8. From this graph I can see that 59% of males achieved above the national average IQ score of 100 while a massive 74% of the females achieved a score of over 100. This shows me that females are achieving higher IQ scores than males. When I looked at this graph and noticed the difference in the amount of male and female students getting above 100 in their IQ score I was very surprised. I was surprised because when I looked at the average IQ score for males and females in year 8 the difference was very slight. After studying this graph more I have discovered that this difference is due to the fact that the students achieving the very lowest scores were females and this has brought the average of the majority of females down.
This line graph above is showing the IQ scores of the males and females in year 10. From this graph I can see that 50% of males achieved above the national average IQ of 100 while 57% of females achieved a score of over 100. This line graph of year 10 IQ scores also shows that females are achieving higher IQ scores than males although not as convincingly as with year 8 students. Overall the percentage of students in year 10 scoring above the 100 mark has dropped from the year 8 score. This could show that the younger students are brighter but I am not going to study this in any more detail.
On the following page I have drawn box and whisker plots to show the spread of the data. This will provide me with more evidence to accept or reject my hypothesis.
I am now going to look at my third and final hypothesis which is, ‘Boys will have better maths Key Stage 2 results than girls’. To accept or reject this hypothesis I will use the data I gathered from the sampling of the students in years 8 and 10. Firstly I will construct a frequency table of the maths results of the males and females in year 8
Year 8 Males
Total = 22 Males
Mean maths result = 4.05
Year 8 Females
Total = 19 Females
Mean maths result = 4.26
From this frequency table I can see that Females are achieving higher Key Stage 2 results than males but the presentation of this table means that the results are not very clear.
Year 10 Males
Total = 16 Males
Mean maths result = 3.88
Year 10 Females
Total = 14 Females
Mean maths result = 3.88
Although the average maths result is the same between male and female the females have got a larger percentage of students achieving the higher grades. I will now construct a cumulative frequency table using the results above.
Year 8 Males
Year 8 Females
Year 10 Males
Year 10 Females
Below are the cumulative frequency graphs of male and female KS2 maths results.
Year 8
Year 10
By looking at these two cumulative frequency graphs I can see that the females have higher KS2 Maths Results than males and I think these two graphs show that my hypothesis is wrong. The female’s line is a lot more horizontal than the male line which is quite steep. This shows that the females have higher KS2 Maths Results than males
By looking at this data I can see that females have better Key Stage 2 results than males so I can reject my hypothesis. I have to say I am rather disappointed at this because I being of the male species myself always thought that males were better at maths than females.
Conclusion
I am now going to state whether I accept or reject my various hypotheses. Although I cannot prove these hypotheses beyond doubt as there are limitations with my data. Firstly I am only using a sample of one school and other schools may have completely different results. Secondly I was only using a small sample of the school and if I had used all of the data provided then I may well have come up with different results. Thirdly I only sampled years 8 and 10 and if I had sampled all of the other years then I would have a more detailed and accurate set of results. Below I have stated my three hypotheses and beside them I have stated whether I accept or reject them.
Students with high IQ scores will also have high Key Stage 2 results. Accepted
Girls will have higher IQ scores than boys. Accepted
Boys will have better Key Stage 2 Maths results than girls. Rejected
I am very pleased with the outcome of this investigation as I have able to prove or disprove my various hypotheses with sufficient evidence. To extend this investigation I could have looked at the Key Stage 4 results of years 10 and 11 to see if the IQ would also be closely linked with these results. I could have used larger sample sizes and more year groups for better accuracy and reliability.