Median = 1.545 (1.55)
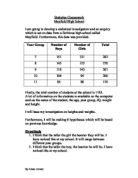
To work out the lower quartile I will find out what 1/4 of the total c.f is and do the same as the c.f but with this number.
Lower quartile = 1.575 (1.58)
To work out the upper quartile I will find out what 3/4 of the total c.f and do the same as the c.f but with this number.
Upper quartile = 1.625 (1.63)
To work out the interquartile range I will take the final number of the lower quartile from the final number of the upper quartile. This gives me the inter quartile range.
Interquartile range = 0.05
Now I have worked out the mean, mode, median, upper quartile, lower quartile and interquartile values for the male heights I will do the same for the male weights.
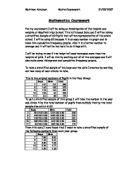
Here is the male weights grouped frequency table:
Here is a pie chart showing the distribution of the weight results:
I will now work out the mean, mode, median, upper quartile, lower quartile and interquartile values for the male weights using the table above the pie chart.
To work out the mean weight I will use this formula:
Σfx
Σf
= 2043.5
43
Mean = 47.52325581 (47.52)
To work out the modal weight I have to find out which group has the highest frequency:
Mode = 40 - 49
The median weight can be worked out by using a cumulative frequency graph. This graph will show the cumulative frequency curve, and will help us to work out the median. By using this graph I can also show the upper quartile, lower quartile and inter quartile range of this data.
To work out the median on this graph I will first draw the graph. I will plot the upper boundaries of the weight variables along the horizontal axis and the c.f along the vertical axis. I will then work out what is half the total c.f and draw a dotted line along to the graph line, and then I will go down from the graph line and read off the value.
Median = 44.5
To work out the lower quartile I will find out what 1/4 of the total c.f is and do the same as the c.f but with this number.
Lower quartile = 40.75
To work out the upper quartile I will find out what 3/4 of the total c.f and do the same as the c.f but with this number.
Upper quartile = 50.25
To work out the interquartile range I will take the final number of the lower quartile from the final number of the upper quartile. This gives me the inter quartile range.
Interquartile range = 9.5
Now I have worked out the mean, mode, median, upper quartile, lower quartile and interquartile range for the male weights. I will do a scatter graph to show the correlation between the heights and weights to see if my hypothesis that the taller the person the higher the weight was correct.
This scatter diagram shows a positive correlation between the height and weight for males. It proves my hypothesis was right.
I have drawn a line of best fit in the diagram so I can use it to estimate any other heights or weights if I need to.
I have shown:
- The sample heights and weights for the males
- Grouped frequency table for the male heights
- Pie chart to represent the distribution of male heights
- Mean, mode, median, upper quartile, lower quartile and interquartile range for the male heights
- Grouped frequency table for the male weights
- Pie chart to represent the distribution of male weights
- Mean, mode, median, upper quartile, lower quartile and interquartile range for the male weights
- Scatter diagram to show the correlation between the male heights and weights
I am now going to list the height and weight data for the females:
Females
Now I have got my sample heights and weights for the females, I will put them into two grouped frequency tables, one for height, and one for weight, then I will work out the mean, mode, median, upper quartile, lower quartile and inter quartile range, and produce a scatter diagram to show the correlation.
Here is the height one:
Here is a pie chart showing the distribution of the height results:
I will now work out the mean, mode, median, upper quartile, lower quartile and interquartile values for the male weights using the table above the pie chart.
To work out the mean height I will use this formula:
Σfx
Σf
= 56.265
37
Mean = 1.5206756676 (1.52)
To work out the modal weight I have to find out which group has the highest frequency:
Mode = 1.50 – 1.59
The median weight can be worked out by using a cumulative frequency graph. This graph will show the cumulative frequency curve, and will help us to work out the median. By using this graph I can also show the upper quartile, lower quartile and inter quartile range of this data.
To work out the median on this graph I will first draw the graph. I will plot the upper boundaries of the weight variables along the horizontal axis and the c.f along the vertical axis. I will then work out what is half the total c.f and draw a dotted line along to the graph line, and then I will go down from the graph line and read off the value.
Median = 1.525 (1.53)
To work out the lower quartile I will find out what 1/4 of the total c.f is and do the same as the c.f but with this number.
Lower quartile = 1.4625 (1.47)
To work out the upper quartile I will find out what 3/4 of the total c.f and do the same as the c.f but with this number.
Upper quartile = 1.5875 (1.59)
To work out the interquartile range I will take the final number of the lower quartile from the final number of the upper quartile. This gives me the inter quartile range.
Interquartile range = 0.125 (0.13)
Now I have worked out the mean, mode, median, upper quartile, lower quartile and interquartile values for the female heights I will do the same for the female weights.
Here is the female weights grouped frequency table:
Here is a pie chart showing the distribution of weight results:
I will now work out the mean, mode, median, upper quartile, lower quartile and interquartile values for the female weights using the table above the pie chart.
To work out the mean weight I will use this formula:
Σfx
Σf
= 1646.5
37
Mean = 44.5
To work out the modal weight I have to find out which group has the highest frequency:
Mode = 40 - 49
The median weight can be worked out by using a cumulative frequency graph. This graph will show the cumulative frequency curve, and will help us to work out the median. By using this graph I can also show the upper quartile, lower quartile and inter quartile range of this data.
To work out the median on this graph I will first draw the graph. I will plot the upper boundaries of the weight variables along the horizontal axis and the c.f along the vertical axis. I will then work out what is half the total c.f and draw a dotted line along to the graph line, and then I will go down from the graph line and read off the value.
Median = 43.5
To work out the lower quartile I will find out what 1/4 of the total c.f is and do the same as the c.f but with this number.
Lower quartile = 39.25
To work out the upper quartile I will find out what 3/4 of the total c.f and do the same as the c.f but with this number.
Upper quartile = 47.75
To work out the interquartile range I will take the final number of the lower quartile from the final number of the upper quartile. This gives me the inter quartile range.
Interquartile range = 8.5
Now I have worked out the mean, mode, median, upper quartile, lower quartile and interquartile range for the female weights. I will do a scatter graph to show the correlation between the heights and weights to see if my hypothesis that the taller the person the higher the weight was correct.
This scatter diagram shows a positive correlation between the height and weight for females. It proves my hypothesis was right.
I have drawn a line of best fit in the diagram so I can use it to estimate any other heights or weights if I need to.
I have shown:
- The sample heights and weights for the females
- Grouped frequency table for the female heights
- Pie chart to represent the distribution of female heights
- Mean, mode, median, upper quartile, lower quartile and interquartile range for the female heights
- Grouped frequency table for the female weights
- Pie chart to represent the distribution of female weights
- Mean, mode, median, upper quartile, lower quartile and interquartile range for the female weights
- Scatter diagram to show the correlation between the female heights and weights
I am now going to group both the male and female data together and put it into two separate frequency tables, one for height and one for weight.
Here is the height one:
Here is a pie chart showing the distribution of height results:
I will now work out the mean, mode, median, upper quartile, lower quartile and interquartile values for the male and female heights using the table above the pie chart.
To work out the mean height I will use this formula:
Σfx
Σf
= 123.3
80
Mean = 1.54125 (1.54)
To work out the modal height I have to find out which group has the highest frequency:
Mode = 1.50 – 1.59
The median height can be worked out by using a cumulative frequency graph. This graph will show the cumulative frequency curve, and will help us to work out the median. By using this graph I can also show the upper quartile, lower quartile and inter quartile range of this data.
To work out the median on this graph I will first draw the graph. I will plot the upper boundaries of the weight variables along the horizontal axis and the c.f along the vertical axis. I will then work out what is half the total c.f and draw a dotted line along to the graph line, and then I will go down from the graph line and read off the value.
Median = 1.55
To work out the lower quartile I will find out what 1/4 of the total c.f is and do the same as the c.f but with this number.
Lower quartile = 1.48
To work out the upper quartile I will find out what 3/4 of the total c.f and do the same as the c.f but with this number.
Upper quartile = 1.6
To work out the interquartile range I will take the final number of the lower quartile from the final number of the upper quartile. This gives me the inter quartile range.
Interquartile range = 0.12
Now I have worked out the mean, mode, median, upper quartile, lower quartile and interquartile values for the female and male heights I will do the same for the female and male weights.
Here is the female and male weights grouped frequency table:
Here is a pie chart to show the distribution of weight results:
I will now work out the mean, mode, median, upper quartile, lower quartile and interquartile values for the male and female weights using the table above the pie chart.
To work out the mean weight I will use this formula:
Σfx
Σf
= 3690
80
Mean = 46.125 (46.13)
To work out the modal weight I have to find out which group has the highest frequency:
Mode = 40 - 49
The median weight can be worked out by using a cumulative frequency graph. This graph will show the cumulative frequency curve, and will help us to work out the median. By using this graph I can also show the upper quartile, lower quartile and inter quartile range of this data.
To work out the median on this graph I will first draw the graph. I will plot the upper boundaries of the weight variables along the horizontal axis and the c.f along the vertical axis. I will then work out what is half the total c.f and draw a dotted line along to the graph line, and then I will go down from the graph line and read off the value.
Median = 46
To work out the lower quartile I will find out what 1/4 of the total c.f is and do the same as the c.f but with this number.
Lower quartile = 42
To work out the upper quartile I will find out what 3/4 of the total c.f and do the same as the c.f but with this number.
Upper quartile = 50
To work out the interquartile range I will take the final number of the lower quartile from the final number of the upper quartile. This gives me the inter quartile range.
Interquartile range = 8
Now I have worked out the mean, mode, median, upper quartile, lower quartile and interquartile range for the female and male weights. I will do a scatter graph to show the correlation between the heights and weights to see if my hypothesis that the taller the person the higher the weight was correct.
This scatter diagram shows a positive correlation between the height and weight for males and females. It proves my hypothesis was right.
I have drawn a line of best fit in the diagram so I can use it to estimate any other heights or weights if I need to.
I have shown:
- Grouped frequency table for the female and male heights and weights
- Pie chart to represent the distribution of female and male heights and weights
- Mean, mode, median, upper quartile, lower quartile and interquartile range for the female and male weights and heights
- Grouped frequency table for the female and male weights and heights
- Pie chart to represent the distribution of female and male heights and weights
- Mean, mode, median, upper quartile, lower quartile and interquartile range for the female and male heights and weights
- Scatter diagram to show the correlation between the female and male heights and weights