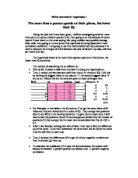
These bar graphs all showed a trend in the fact that they peaked in the same sort of area, which is 100 to 106 IQ in the 0 sibling and 6+ sibling groups, and a double peak in the 1 – 5 sibling groups. The double peak in this case is in the same sort of area, 91 to 109 IQ range.
I then averaged all the IQ’s for each sibling group so I could see the general trend when compared to each other and against the KS2 results (see Fig 4). When I looked at the average IQ I saw that there was a very slight drop in IQ towards the higher sibling groups, an anomalous jump at 5 siblings then a drop back to normal at 6+ siblings.
IQ Conclusion
From these results I conclude that the amount of siblings a person has, has no effect on the IQ of said person. I know this because the IQ’s for all the siblings were very similar except for the 5 sibling group, which was noticeably higher when compared with the other groups.
KS2 Results
I used the same KS3 and 4 pupils as before to make another 3 scatter graphs showing the achievements of the sibling groups in each subject. At this point I looked for a line of best fit but the line was almost horizontal so it would have been of no use. I then made individual bar graphs each containing one type of sibling group. Each contained 90 pupils, the graphs showed the achievements of that group..
After making 7 graphs of 0 to 6+ siblings for each subject I noticed that the only pupils in English with level 6 KS2 results were the pupils with no siblings, and the pupils with level 6 in Maths were those with either 0 siblings or 6+ siblings. In Science 4 groups have KS2 level 6 results, but the pupils with 0 siblings have the most level 6’s. The concentration of marks for each group is still the same around level 4.
I then made pie charts for each subject so that I could more clearly see the marks each sibling group got in the KS2 tests. The pie charts show more clearly where the amount of marks went and in the case of the level 6’s were the majority were.
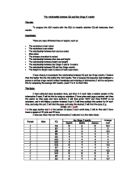
In fig 1 I found the average of the KS2 results for each sibling group, however there is very little difference between the average score. The only real difference is in the 6+ sibling group were the Science and English results are highest in the table, but in Maths the 0 siblings are highest. This table dispels my theory that pupils with, 0 siblings have better results than pupils with siblings.
I then went on to make fig 2 (which uses the data from fig 1), so I could see any sort of trend easier. Although fig 2 didn’t quite achieve what I was looking for it did show a drop in marks towards the higher sibling count groups, but a strange peak in the 6 and above sibling count group. After examining fig 2 I averaged the 3 subject results again so I could better see the trend. After I had produced fig 3 I saw there were a couple of troughs in the graph, but there was no real trend except for a slight dip between 1 and 5 sibling groups. It is obvious in fig 3 that pupils with 0 or 6+ siblings have better results (on average) than people with 1 to 5 siblings.
Fig 1.
Fig 2.
Fig 3.
Fig 4
KS2 Conclusion
From these results my conclusion is that if you are an only child or have 6+ siblings you have a better chance of getting a high KS2 result. If you have 1 to 5 siblings your results will get lower as your siblings increase.
Final Conclusion
My original hypotheses do not stand up when confronted with this evidence. An increase in the number of siblings does not result in a decrease in IQ, but those with 5 siblings stand out as having a higher average IQ.
A lower IQ does not result in lower KS2 results. The pupils with the highest KS2 results have an average IQ and the pupils with the highest IQ have an average KS2 result (I found this by comparing Fig 3and Fig 4).