The questions I have chosen to ask in my pilot survey are-
- How old are you?
- Are you male/female?
- What height are you in centimetres?
- What weight are you in kg?
- Are you left or right handed?
- What is your shoe size?
- What is your hand span?
- What colour is your hair?
- What colour are your eyes?
- How much pocket money do you get per month?
I have chosen to ask around 10-12 questions in my questionnaire. I feel that this is a sufficient amount to give me enough figures to use in my analysis of the results. It will also only take around a minute for each person to fill out the questionnaire which is about the right time, if it was any more then some of the people I ask many not want to finish it giving me inconclusive results.
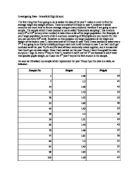
In my proper survey, I will ask 30 people these questions. I chose this amount because it was even (I could have 15 boys and 15 girls), it was a suitable number bearing in mind the time limit and because it will give me a reasonable average. I will ask 10 people in my pilot survey, 5 boys and 5 girls. This amount will give me an indication to whether there is anything that will need to be changed before my revised survey. My results are shown below along with the questionnaire that I gave to each person to answer. I chose to give them a questionnaire to fill out themselves instead of asking them all individually to save time. By doing this, I could just hand out sheets to many people at the same time so I could collect the results in much faster.
Questionnaire:
Analysis of pilot survey The pilot survey has helped me a lot in this investigation so far. It has helped me to identify all the problems that need to be resurrected. From the questions I have asked I can see that there is one question that will need changing. When I asked, " How much money do you get per month?" I found that there was one boy and one girl that did not want to answer the question because they found it private. I must respect their privacy because it is these people that are helping me with my investigation. To solve the problem, I will get rid of this question and another one instead. The question that I have chosen to ask is "What SAT's results all added together did you get in year 9?
When writing out the questionnaire, I also had to make sure that the questions that I was asking were completely fair and in no way bias. If they were then the investigation would be made unfair and the results would be inaccurate.
Below I have done a graph of Height against weight for males and females. This will help me to see if the results I will collect are suitable for correlating and it will enable me to tell which is the best method of graphs. This will also help me to make a hypothesis of my pilot survey and preliminary findings. I predict that as the height goes up, so does the weight of the person.
From the graph, I can clearly see that there is an extremely good positive correlation between the height and weight of males as is shown by the line of best fit. With only one exception, as the height increases, so does the hand span. This is because I have one anomalous result that doesn’t fit in with the pattern but as I can see from the line of best fit, that there is definitely a trend to follow. I calculated my line of best fit by working out the average of both the height and the weight and plotted these against each other, and swivelled my line around this point. The graph and my results show me that the type of information I that I have collected is good to analyse.
This now concludes my analysis of my pilot survey and I can now go on to study my actual investigation with my new revised plan. From using my pilot survey, I have now decided what questions I am going to use in my investigation. They will all give me reasonably accurate results and they are all able to fit into my time limits. Below is a list of all the questions I am going to ask and reasons for why I chose them.
-
Age: I am investigating pupils in year 11 so everybody I ask should be either 15 or 16. If they are not then I will not include them in my investigation because it will not be a fair test. Anybody older or younger will give me different results and so will disrupt the average.
-
Gender: This is one of the most vital pieces of information I will be collecting because I have chosen to investigate the differences between the average male and female. I can then compare how each gender is different in various different ways.
-
Height: Unlike the previous questions, this is a continuous variation and therefore I could get a wide range of results giving me more interesting comparisons in results. I also think that it will be proportional with other questions I that I am asking like weight and hand span. This will also give me an interesting average at the end of the investigation to see how people measure up in comparison. I can also compare how accurate my results are with exterior sources.
-
Weight: I have chosen weight for the same reasons I have chosen height. I realise that some people may be reluctant to give their weight because they feel embarrassed. If this is the case then I will need to use quota sampling in my investigation.
-
Left/Right handed: For this question, I expect that the majority of people I ask will be right handed. However I will be interesting to see if there are any other proportional factors that affect the result.
-
Shoe size: As with height and weight. I think that this factor will be affected by other factors like height and gender.
-
Hand span: I should see that height and gender affect this result. It would be interesting to see if the had span has any correlation with shoe size.
-
Hair colour: This is a discontinuous variation. So I may choose to use a different graph, like a bar chart for example because it will show more accurate results. I think that this is one factor that will not be affected by any other variable other than perhaps eye colour.
-
Eye colour: There are only 4 variables for eye colour and (like hair colour) should not have any comparison to any other results I have collected.
-
SAT's results: I chose to investigate this instead of money per month. With this question, I must take into consideration that I was asking the top maths classes and so they are academically higher than average. It was impossible for me to ask people of different intellectual abilities. Therefore this is only the average of students in the top maths class. It will be interesting to see which gender is more intelligent according to my survey. I will measure it by adding up their results from English, maths and science. So if somebody got 777 then there result would be 21.
These are the factors that I will be investigating in my task to "find the average student".
Hypothesis: After analysing my pilot results, I can predict the sorts of results in proportion and comparison from all my information. For example, I think that the taller the person will be, the bigger the hand span, the larger the weight, the bigger the size of their shoes will be and the likeliness of it being a male will increase. I also think that the girls SAT's results will be marginally better than the boys because they are academically stronger at this age. I don’t think that there will be any factors in my investigation that affect whether the person is left or right handed. I do not know if the colour of hair and eyes will be a comparison though, that is something I will have to investigate to find out.
I have now made a revised questionnaire with the new question added to it. I will give one of these to each person involved in my survey for them to fill out and give back to me. From this I can collate my information into tables, 15 for boys and 15 for girls. Then I can use the table to get the information needed to analyse the results. I have chosen a table to display all my results because it is easy to read and displays all the information clearly. When I use graphs to analyse my results, I will use either scatter grams or bar graphs. This is because they are extremely accurate. Most of these graphs will be done on the computer because it is more accurate than doing it by hand and it is also a lot quicker. Once I think I have analysed enough information, I can then go on to my conclusion and evaluation into how good and how accurate my investigation really was.
Below is a sample of my questionnaire that was given to all of the pupils taking part of my investigation.
30 of these had been printed to give to each person answering the questions. Some are in tick-box format, but some needed a written answer to be added into the box. I found that I was simple to create a tally chart with the way the questionnaire has been set out.
Results: The tables below show the results of the 30 random pupils I asked to take part in my experiment. I have separated it up into males and females because I needed to have 15 of each and it will be easier to take results when I am comparing between the two. Once I have these results in my table, I can start to explore into the average student using graphical methods. I will firstly collect the mean, median, mode and range I give me an insight into what my results are showing me. Then I will do an extended analysis where I will use standard deviation, cumulative frequency and will compare individual sets of results to see if there is correlation.
Below is my table of results:
Now I am going to calculate the mean, median, mode and range. I list of what each does is as follows:
-
Mean: Sum of the results divided by all of the results. Dictionary definition: "The quotient of the sum of several quantities and their number."
-
Median: The middle value. Dictionary definition "the middle value of a series of values arranged in order of size."
-
Mode: The value that appears most often. Dictionary definition: "the value that occurs most frequently in a given set of data."
-
Range: The difference between the largest and the smallest digit. Dictionary definition: "the region between limits of variation."
Below are my tables of results. I have chosen to do the boys and girls separately to compare what is given. The results are given to two decimal places because the accuracy doesn’t need to be any greater than that.
After calculating the averages, I am able to see any patterns in my results. I can see that many of them follow my prediction. The height of the boys is conclusively higher than the girls' heights, which was to be expected. As was the weight, hand span and shoe size. So overall I can see that the boys are physically bigger in all areas. However, it also shows that the average SAT's grades were higher for girls than for boys. I had also predicted this but it was just a guess and I had no mathematical proof why. It was interesting to see that there were no results in which the boys and girls had the same or extremely close results. This indicates to me that gender does play a big part into the attributes of an average pupil. I can now go on and study the differences further.
I have chosen to do 15 results for each gender. This has helped when it came to calculating the median because there was a middle number to choose. If I had an even number of results then I would have had to take the average of the middle values.
I have decided to work out the standard deviation for the height and weight for both males and females. This was because they produced the biggest range of results from the range table and therefore should show the biggest deviation of the mean. Below are tables to show how I worked out he male and female height deviation and below that is a table of results for both the height and weight.
The standard deviation didn’t help my investigation as much as I had hoped because I only chose to find the weight and height deviation. I thought that this would be better because they had the biggest range and therefore would give me the most interesting results. However, I think it would have been a better idea for me to find the standard deviation for every factor possible so I could collate the results and maybe put them into a graph. I was expecting the results that it gave me though because there ranges were bigger in the range average table. In the range table the range of height was bigger for the girls but the range of weight was bigger for the boys. It is the same in the standard deviation table. I predict that if I were to find the standard deviation for the rest of the factors, then it would follow the trend of the range table. Therefore it would show me that the girls had a bigger range overall in all of the factors. This indicates to me that boys are more alike and girls vary more at this age. I could carry on my investigation to see if this really was the case but my time limit prevents me from doing this.
As part of my extended investigation, I am also going to investigate the cumulative frequency of some of my data. I can use this curve to estimate useful statistical measures like the median, lower quartile range, upper quartile range and interquartile range (a measure of dispersion). This is will be useful information in my investigation to find the average student. Due to my time restrictions, I will only find the frequency of one factor from my continuous data. I have chosen to use height as it has an interesting set of results that can be sorted into groups easily and quickly. I will do both the male and female frequencies on the same graphs so I can see if there is a difference. I have spit the data into sensible groups so I am able to tally all of the results. Below is my cumulative frequency table and graph for the height of male and female pupils.
The table of a females’ cumulative frequency is above and the graph is below along with the males’ results. The cumulative frequency table for the males is below. The interquartile range, upper quartile range etc will be added on by hand.
From the graph of results, I can see that the range of height is longer for females’. That is why the line carries on for longer than the males’ pink line. Also the line for the males’ goes up steeper than the females’ creating a smaller interquartile range. However, this also means that the median and the upper quartile and lower quartile ranges will be larger than the females. These points can be seen clearly on the graph.
I could carry on the investigation using cumulative frequency to investigate all of my continuous data but my time limit prevents me from doing this. The height tables and graph however give a reasonable example of what information is portrayed by using cumulative frequency.
Along with graphical methods, I can use external sources to find information to help me with my investigation. This is what I am going on to investigate next.
External Information: As part of my investigation, I have decided to use information that I have collected from external sources about averages and “the average student.” By doing this, it will indicate to me whether or not I am on the right track or if I have gone wrong in my investigation. Most of the external information is extremely accurate because it is based on thousands if not millions of people, this is something that I couldn’t possibly do in my experiment and so my information will not be as accurate.
There are many places were I can find this sort of information, the Internet or in a library are the main two places. I chose to find information about the average height of 15-year-old children all over the world. I discovered the information on a medical website. However, because it is American, the information was in inches so I will have to change it over to centimetres. I did this by multiplying the number by 2.5 because that is how many centimetres there are in an inch. The information I found is in the bullet point’s below-
-
For a 15-year-old male, the average height would be 67 inches, which is 167.5cm’s (50th percentile) and the normal range would be from 63 inches, which is 157.5cm’s (10th percentile) to 72 inches, which is 180 cm’s (90th percentile).
- The average height for a 15-year-old female would be 64 inches, which is 160 cm’s with the normal range being from 60.5 inches, which is 151.25 cm’s to 67 inches, which is167.5cm’s.