Maths Statistics Coursework – Mayfield High School
Introduction:
I have been approached by my local council who would like to try and gain a better understanding of obesity in the local community. The body mass index is the universal measurement of whether a person is overweight. They are trying to decrease the number of future cases of obesity and therefore, I must look at the future generation of adults, so I will take this case back to its origin, I will take it back to school. All the data that I require for this project will be provided by the council. All results are from a local school called “Mayfield High School”.
body mass index = weight/height²
Phase A:
As 1180 pupils is an extremely large number to work with, I have decided that I will carry out a sample. The type of sample that I will carry out is called a stratified sample. This means that I will arrange them all in the order that I am going to investigate, and then keep deleting entries and save every nth term. I have done this so I get a nice small sample which is easy to work with, and most importantly, represents the data that I am dealing with. Sampling is more efficient and takes less time than using all the data.
After carrying out my sample and ending up with 100 statistics, I created an extra column in my table called BMI (body mass index). I felt that using the body mass index would be a more accurate representation of a persons health. Because, although a persons weight may be normal, they may be very short and obese. It is the combination of height and weight that enables us to tell how overweight/underweight someone is. After doing this, I rearranged the whole table and sorted it by body mass index. Then I created a cumulative frequency table. My categories for this were for people having a body mass index between:
- 0 and 10
- 10 and 15
- 15 and 20
- 20 and 25
- 25 and 30
- 30 and 35
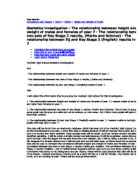
After I calculated the cumulative frequency I created a cumulative frequency graph reflecting my results. However, it can be difficult to see the skew of the data and where the median lies. For this, I have also plotted Box and whisker plots, which shows where the middle 50% of the data lie and where the median lies. This will help me see all of the body mass indexes in my sample. If my sample is an accurate representation, I should be able to get a feel of all of the heights in that school. In the appendices you can see the cumulative frequency table that the graph was plotted with.
From the graph I can tell that there are a fair range of heights in that school. To see more clearly where the middle amount of data is I will need to draw a box and whisker plot. This box and whisker plot and this graph, are for heights of pupils in year 7 to year 11 and it includes both boys and girls.
From this box and whisker plot I can tell that the median MBI from the data that has been sampled is 19.0. I have also concluded that the middle 50 percent of the values lie between the 25th percentile and the 75th percentile, which are 17.3 and 21.85. The box and whisker is quite skewed to the left, which means that the majority seem to be either healthy or slightly underweight. However, this data is not very conclusive, therefore, I will now separate the data to analyse other affecting parties on the BMI. The two that I would consider as being the major two are age and gender. Although they both make huge differences, I believe that age will be the more major contributor, especially in the younger years when puberty has not really started to kick in. Therefore I will now split them up by age.