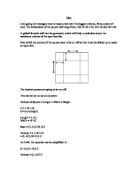
In order to obtain a clearer view of how the volume changes with the size of the cut, I have plotted a graph.
As the graph shows, the maximum value for volume lies between 3 and 4cm , where the graph is at its peak.
I will now use a larger square, 20 x 20 to see where the largest volume occurs.
This is the 20 x20 square.
The table shows that when the size of the cut (height) is 3cm, the volume of the square is at its peak, being 588cm3.
The above graph is shows the volumes of the 20 x 20 piece of card. As it can be seen, the graph reaches its peak again between 3 and 4. So when the size of the cut is between 3 and 4cm, the open box has its maximum possible volume.
A graph showing values between 3 and 4 has already been created, and so I will move further into the investigation and see if the 30 x 30 square also follows this trend.
The is a table showing results for a 30 x 30 square.
This time, the highest figure for volume is when the height, meaning the size of the cut is 5cm.
The maximum value now lies between 5 and 6 cm. so when the square is 30 x 30, the maximum value has increased from between 3 and 4cm to 5 and 6 cm.
I will now see if the maximum value increases to 6 or 7cm, with a 40 x 40 square.
The table indeed shows that the maximum value for volume occurs somewhere between 4704 and 4732 cm3, when the height is between 6 and 7cm.
All four graphs show that the volume of the box increases up until a point and then it decreases again. For example, in the 20 x 20 graph, the volume of the box is 324cm3 when the length is 18cm and then it increases to 512cm3 when length is 16cm, until it reaches 576 when length is 12cm. from here onwards the volume decreases.
To find where the maximum value for volume lies, of any length square, I need to create a global formula. This will be done with trial and error.
The relationship will be between the length of the sides of the square and the volume. This formula will give the maximum value of volume for any length square.
To begin with, I can try dividing the length of the square with the size of the cut to see when it reaches a figure that gives the maximum value. This is to be done with all three squares.
The highlighted cells show that the finding match my table.
When the length of any sized square is divided by 6, the figure we get is where the maximum value for volume lies.
For example, with the 40 x 40 square, the table of results showed that the maximum volume is between 6 and 7cm, and the trial and error method clearly found it out to be correct.
So in order to find the maximum value for any size square, the equation would be top divide the length by 6
Maximum value = L/6.
I will now experiment with a different ratio of sides. For example, the preivios investigation involved a square with sides of a ratio of 1:1
I will now use 1:2.
A 20 x 30 rectangle.