Read All About It
Suresh is comparing magazines and newspapers.
He chooses a passage from one newspaper and one magazine. They each contain 100 words and he counts the lengths of all the words.
Suresh then says that the magazine has the shortest words.
Write a hypothesis about the length of words in newspapers and magazines.
Design and carry out an investigation to test your hypothesis.
Investigate further.
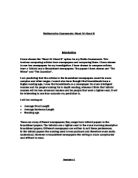
Introduction
Suresh's hypothesis seemed to me at first to sound quite correct, that words in magazines would be shorter than those in newspapers. But then I realised that this was taking for granted that the newspaper would in a way be more 'serious' than a magazine, as my first thoughts on a magazine were those that wrote about celebrities and contained a lot of photographs. However, I do not think that this generalisation would hold with all magazines and newspapers, for instance, if I was to compare a magazine such as "Sight and Sound" which is a magazine about films, but one that examines films in quite an in-depth way, having interviews and articles on 'art-house' films for instance - with a newspaper like "The Daily Sport", aimed at men who prefer titillation to topical news stories, then I believed that Suresh's hypothesis may be proved wrong.
As there is an enormous variety of magazines in the shops I tried to figure out a way of narrowing down the options for a comparison of word lengths. I decided upon newspapers. General newspapers, those that are most common and read daily by a large percentage of the population, are already split into two different types, so I had my two groups from which to sample from already before me - the broadsheet and the tabloid. The broadsheet being newspapers such as The Times, The Independent, The Guardian and The Telegraph, and the tabloid group containing The Sun, The Mirror, The Star and The Daily Sport. Both of these groups are known to most people and I was sure had certain assumptions linked to them. For instance, I am quite sure that most people would agree that the broadsheet newspapers are presumed to be read by more professional, educated, middle-class people, whereas the tabloids main target group were more likely to be thought of as employed in blue-collar jobs (labouring, skilled, semi-skilled) having ended their formal education by the age of 16 and are working class.
These were generalisations though, and I wanted to believe that the broadsheet would contain on average the same length words as a tabloid. By looking at the newspapers I could see that there were far more in-depth articles about the news stories in the broadsheet than the tabloid, that there were far more small snippets of stories in the tabloid, as if they were meant to be read quickly, and that the broadsheet contained far more articles on news items such as 'business news' than the tabloid which seemed to have a far larger proportion of its coverage dedicated to the lifestyles of the rich and famous. Even so, I did not think that this necessarily entailed the tabloid having shorter words than the broadsheet as if its audience were somehow less intelligent.
Hypothesis
"I believe that the word lengths of a broadsheet compared with the word lengths of a tabloid newspaper would on average be the same."
I believed this because even though the broadsheet papers tended to go into specific news stories in far more depth than the tabloids, and that the tabloids concentrated far more on the pull of sex and celebrity to sell their papers rather than concern with the news, whether the tabloids actually use shorter words because they believe that this is all that their target audience would be able to understand is a hypothesis which I find rather uncomfortable and is one that would require contacts at a major tabloid newspaper to prove, which I do not have - at this time. And so I am going to begin this research with an open mind to hopefully allow the results of my investigation to speak for themselves, rather than press my assumptions onto the results thus manipulating the conclusion.
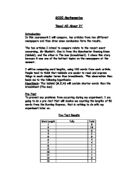
Method
To begin with I chose two newspapers. The Independent is a broadsheet newspaper that, as its name suggests, likes to report the news in an unbiased way - whether or not that is possible is not for consideration here, but perhaps because of its name I decided to choose this for my broadsheet sample.
For the tabloid newspaper I chose The Mirror - this is a widely read newspaper and had the advantage of having the least amount of naked women in it.
I would compare two samples of the newspapers. A ...
This is a preview of the whole essay
Method
To begin with I chose two newspapers. The Independent is a broadsheet newspaper that, as its name suggests, likes to report the news in an unbiased way - whether or not that is possible is not for consideration here, but perhaps because of its name I decided to choose this for my broadsheet sample.
For the tabloid newspaper I chose The Mirror - this is a widely read newspaper and had the advantage of having the least amount of naked women in it.
I would compare two samples of the newspapers. A sample being the first 100 words of an article. To choose the article I decided beforehand that I would use the main story - given that they were the same. This however did not work as they both had different main stories on the front page. The Mirror did have the story on the second page though, and as I realised that it may be difficult finding two articles about the same news story in the same place, I decided that using the same article would be a better sample than simply picking the main story. This was because as they would both be talking about the same subject, I thought that this would be a good way of comparing average word lengths.
I would first find out the average word lengths of the articles, while discussing what the 'average' actually is. I will find out the mean, median and mode of the word lengths to see if this would produce any evidence for my hypothesis.
I would present the raw data in chart form to make it more readable.
And I would try to draw out any tendencies that the data presented which would enable me to reach a conclusion about my hypothesis.
Stage One - The Collection
To count up my samples I used a tally chart, as this seemed the most efficient way of counting the word lengths, I then added them up and produced the following frequency charts. In this way the raw data could be easily referred back to.
Frequency Chart for Broadsheet
Length of Word
Frequency
2
2
4
3
25
4
2
5
6
5
7
9
8
1
9
4
0
6
1
8
2
2
3
0
4
Total 100
Frequency Chart for Tabloid
Length of Word
Frequency
4
2
3
3
8
4
7
5
1
6
3
7
1
8
7
9
3
0
2
1
0
2
3
0
4
0
Total 100
I then put this information into two bar charts to see if any trends or patterns or differences appeared.
Certain things stand out from the charts, it is easy to see that a word length of 3 is by far the most popular word with a total of 25 hits, which is 25% of the total.
Looking at the broadsheet chart the rest of the totals show no particular pattern, although there does seem to be quite an even spread across the field, except those for 1 letter words and the larger words, with 12, 13 and 14 together only totalling 3% of the total. There is a slight decreasing curve if one takes the numbers 2, 4, 7, 10 and 12 - though again this is punctuated by the exceptions of 8 and 11. Hopefully comparison with the tabloid chart will throw up more detail.
Looking at the tabloid there is a much more pronounced pattern. There is a steady increase from 1 until 3 (again the most popular word length) and then a steady decrease with only one exception (5) continuing down to 12, with 11, 13 and 14 scoring none at all. There also looks to be a much higher number of words in the 2-6 word length categories in the tabloid, in fact this counts for 72% of the total, whereas in the broadsheet, this category only counts for 57%. (As the samples were of 100 words each this was a very easy calculation to do - I referred back to my frequency charts and added up those rows).
To see just how similar the information is, I decided to do a scatter graph. This would show me exactly how similar the two sets of datum are. By doing a scatter graph I can then show a line of 'best-fit' which will tell me if the datum is strongly related or not at all.
Scatter Graph
Unfortunately my computer did not have a 'line of best-fit' feature, so I have drawn it in myself. I understand it to be a line which tries to get in the middle of the two sets of datum, so that I have an equal number of points on both sides. I think it is fair to say that this proves without a doubt that the two sets of data were quite different.
Having used frequency charts and a scatter graph I saw that they were not providing me with any significant information and so I decided to look at the information in another way.
Mean, Median and Mode
One of the most common ways of finding the average of something is by looking at the Mean, Median and Mode of a set of data. However, from the very fact that we have 3 categories here we can see that this itself is problematic. This is because there is more than one definition of the word average, and as we shall see, the three ways of measuring 'average' may produce different results.
Mean
Broadsheet To find the mean I calculated the total number of letters in the 100 word article and divided by the total number of words which gave me the average length of word. (Total Fx divided by Total Frequency)
561 / 100 = 5.61
(5.6 correct to 1 d.p.).
Tabloid And I repeated the method with the tabloid:
477 / 100 = 4.77
(4.8 correct to 1 d.p.).
Length of Word
Frequency
Fx
2
2
2
4
28
3
25
75
4
2
48
5
5
6
5
30
7
9
63
8
1
88
9
4
36
0
6
60
1
8
88
2
2
24
3
0
0
4
4
Total 100
561
Length of Word
Frequency
Fx
4
4
2
3
26
3
8
54
4
7
68
5
1
55
6
3
78
7
1
77
8
7
56
9
3
27
0
2
20
1
0
0
2
2
3
0
0
4
0
0
Total 100
477
Median
Broadsheet The median is the middle number of the results. As we were testing with 100 words, the median would be the 50th word. Having already listed the results in ascending order, I simply had to count to the 50th.
The 50th word was in the row for lengths of word - 4.
According to the median then, the average length of word in the broadsheet is 4.
Tabloid I repeated the method. The 50th word was again in the row for lengths of word - 4.
Mode
Broadsheet The mode is the most common value. So from my table it was easy to see which length of word was the most common. It was 3. So 3 was the average according to the mode formula.
Tabloid 3 was the average for the tabloid too.
Here we see then that the 3 ways of calculating average have given us 3 different results.
Method
Broadsheet
Tabloid
Mean
5.6
4.8
Median
4
4
Mode
3
3
So if I was trying to prove that there were no differences between the two papers I could state that according to the median and the mode of the data, there were no differences. However, if we looked at the mean then there was a difference.
I think that when it comes to using these methods to find averages then I think it would be better to use them in conjunction with other methods. Sometimes it may be obvious which method to adopt, but in this case I will have to look at the data in more detail. I decided to look at the range of the data, to see if this was important in my analysis.
Range
The range shows us the boundaries of the samples we have used in a simple formula, which in this case will be the highest lettered word minus the lowest. So for the Broadsheet this is 14 minus 1, which equals 13 and for the Tabloid this is 12 minus 1 which is 11.
The range can be problematic though. If we look at the tabloid information again we can see that there is only 1 twelve letter word out of a hundred, that is just 1%, and there is not even an eleven letter word so it would seem that the twelve is an exception. Looking at the tabloid bar chart it seems to make far more sense to count the range as being between 1 and 10 as this is a solid run of results. If this is the case then 10 - 1 = 9, the range would only be 9. This may seem like only a small difference but as I am trying to see if there are any differences between the two papers, then the difference between the broadsheet's range of 13 and a range of 9 for the tabloid is more significant than had it been 13 and 11. I think this example also shows how easy it may be to manipulate statistics to conform to what one wants.
If we go back to the correct results of the range; 13 and 11 then this really gives us very little information whatsoever. We can however use range in a more detailed way, this is by using the Interquartile-range.
The Interquartile-range
The good thing about the interquartile-range is that it gets rid of the extremeties of a sample, so in our investigation it gives us more of an idea of the most commonly used words which may give us a better understanding of the 'average' of the two newspapers.
The interQUARTile range deals in quarters. Whereas the median gives us the middle of the sample, the interquartiles will give us the first quarter (25%) and the third quarter (75%) - and the information that lies between them is the interquartile range.
The best way of showing this information is in a graph. And the graph to use is a cumulative frequency graph.
Cumulative Frequency
To begin with I go back to my frequency tables and add in the cumulative frequency column. This will give me the plot points for my graph. I then entered these plot points onto my cumulative frequency line graph.
Broadsheet
Length of Word
Frequency
Cumulative F
2
2
2
4
6
3
25
41
4
2
53
5
54
6
5
59
7
9
68
8
1
79
9
4
83
0
6
89
1
8
97
2
2
99
3
0
99
4
00
Total 100
Tabloid
Length of Word
Frequency
Cumulative F
4
4
2
3
7
3
8
35
4
7
52
5
1
63
6
3
76
7
1
87
8
7
94
9
3
97
0
2
99
1
0
99
2
00
3
0
00
4
0
00
Total 100
From the cumulative frequency graph I have deduced that the interquartile-range for the two newspapers are as follows:
Tabloid: 3 to 6.5
Broadsheet: 3 to 8.2
A difference of 1.7 letters per word has been shown with this graph. It is also very useful at showing us the median of the two newspapers. For the tabloid the median is 4.2 and for the broadsheet it is 4.2 (this is a different result from the workings I used earlier).
My investigations so far have shown a slight difference between the papers, and this difference has been with the broadsheets showing a larger range than the tabloid and in only one of the methods a larger average (the mean). However I feel that the sample I have been working with is too small for a proper conclusive answer to my hypothesis. I am therefore going to take two more samples from the papers, again looking at similar stories rather than positioning but this time I am going to take 200 word samples. By doing this I hope for a more definite answer to my hypothesis, a more mathematically sound result.
Results of a 200 Word Sample - Broadsheet
Length of Word
Frequency
Fx
Cumulative F
6
6
6
2
31
62
37
3
42
26
79
4
41
64
20
5
6
80
36
6
23
38
59
7
6
12
75
8
3
04
88
9
5
45
93
0
2
20
95
1
1
96
2
2
24
98
3
3
99
4
4
200
Total 200
Total 919
Results of a 200 Word Sample - Tabloid
Length of Word
Frequency
Fx
Cumulative F
5
5
5
2
34
68
39
3
34
02
73
4
34
36
07
5
30
50
37
6
6
96
53
7
5
05
68
8
3
04
81
9
8
72
89
0
5
50
94
1
3
33
97
2
3
36
200
3
0
0
200
4
0
0
200
Total 200
Total 957
A quick glance at the Mean, Median and Mode:
Mean Broadsheet 919 / 200 = 4.595 (4.6 correct to 1 d.p.)
Tabloid 957 / 200 = 4.785 (4.8 correct to 1 d.p.)
Median Broadsheet 100th word = 4
Tabloid 100th word = 4
Mode Broadsheet 3 (most common length)
Tabloid 2, 3, 4 (there can be more than one mode!)
Method
Broadsheet
Tabloid
Mean
4.6
4.8
Median
4
4
Mode
3
2, 3, 4
The Mean with the 200 word sample seems to (a) have lowered and (b) drawn the results closer together. There was a 0.8 difference between the papers in the original investigation, with the broadsheet having the higher length, now this is reversed and there is only a 0.2 difference.
Range
For the broadsheet this is the same: 14 - 1 = 13
The Tabloid: 12 - 1 = 11
This is the same as the 100 word sample.
I had intended to miss out the bar charts thinking I would glean no new knowledge from them, but as my results so far have shown nothing new I decided to see if there were any visible differences:
It was striking to see that the patterns were very similar to that of the 100 word samples. The broadsheet showed a disrupted pattern, with 5 again showing a dip, strong 3 and 4 letter words and a steady decrease at the end. The tabloid too showed remarkable consistency, strong 2, 3 and 4 letter words and a gradual decrease down to 12.
Although alone these bar charts do not exhibit much information, I think that by comparing them to the 100 word samples, to see the similarities when comparing the broadsheet 100 to the 200 sample, and the tabloid 100 to the 200 sample, are so pronounced that it shows that there is a difference in the word lengths of the two papers, though not necessarily easy to spot, but a difference none the less. I think this has been a feature of this investigation, the very limited scope I may have given myself. What is appearing though must be a different usage of language between the two papers.
Finally I shall again look at the cumulative frequency graph as this gave me the most detailed information and appeared the most correct as the results that came from it, the interquartiles and the median gave similar information to that which I had gathered so far, that the broadsheet had on average a longer word length than the tabloid:
Key: Series 1 = Broadsheet
Series 2 = Tabloid
The Interquartile Range:
Tabloid: 3.9 to 7.3
Broadsheet: 3.9 to 7.1
The range difference was a mere 0.2 (length of word) and this was in the tabloids favour - this was contrary to what had been deduced earlier.
Median of the Tabloid: 5.3
Median of the Broadsheet: 5
The difference in median was 0.2, again in the tabloids favour, and again this was contrary to what I had found earlier, with the 100 word sample.
My theory had become undone, rather than produce what I thought would be a firmer foundation on which to state that my hypothesis was wrong, I had actually strengthened it by the examination of two different samples.
I realised that I should continue examining other samples, for only by a larger amount of samples could I hope to find a trend, that one paper used longer words than the other. Or had I hit upon the answer, that my hypothesis was correct. One thing I was quite sure of was that any difference was very negligible. Both tests had shown that the broadsheet used more words containing 12, 13 and 14 letters, this was evident from the first action, collecting the data, but the 'average' word length, however you wished to define this, was interchangeable.
4