Hypothesis
I believed at first that in my initial investigation, the higher the level of unemployment was then the higher the turnout would be because they would have the incentive to come and vote to make a change in their lives, and wouldn’t be at work anyway so would probably find it easy to find time to vote. However, when I made a small preliminary chart from the first couple of data entries, the correlation seemed to suggest that this hypothesis was wrong and it was actually the opposite. To work with this I have revised my hypothesis to say that I believe that the higher the level of unemployment is then the lower the turnout will be. This would be shown by a negative correlation on the scatter graph.
For the further investigation, I believe that a higher proportion of Labour constituents will be unemployed to the proportion of Conservative constituents in that position, as Labour is traditionally known as a party aimed at poorer, working class and unemployed people and does not believe in such Conservative policies such as privatization. If my hypothesis is correct, the Labour box and whisker diagram will be plotted further up the scale that the Conservative one and it is likely that the median and interquartile ranges will also be higher for Labour.
Initial Investigation
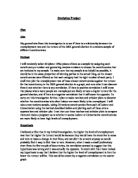
After sampling the data and plotting a graph from it, this is the graph of the results which I got from plotting unemployment rate against turnout:
Using Microsoft Excel I added in a trendline, which although it is not striking, seems to show a negative correlation which would mean that the higher the unemployment rate is, the less likely people are to turn up to the general election. This supports my hypothesis quite well, although there are some anomalies. The anomaly that is particularly striking is Newry and Armagh, who although they have a 4.6% unemployment rate, they managed a very high turnout of 76.3%, possibly meaning that either there is a mistake in the records, or more likely that this is just an exception that did happen for any number of reasons. If it is a small constituency then it would probably be easier for a higher turnout even if they are unemployed, so that may be the reason. Due to this, I do not plan to remove this point as I think that it is correct data and should not be overlooked. Other than this however, apart from a few straying from the line, most of the points fit with the hypothesis and it works out quite well to how I had imagined.
Investigation 2
My results from my further investigation worked out like this:
Labour
Conservative
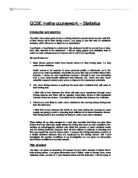
This data alone can already support my hypothesis quite strongly, but to make it more vivid I will present it on the planned box and whisker diagrams to show exactly what I meant.
Unemployment rate (%)
The results on this diagram are quite striking, making it very obvious that my hypothesis was correct in saying that Labour constituencies would be more likely to have a higher rate of unemployment than Conservative constituencies. We can see this from the fact that the maximum, median and quartile values on the Labour plot are all much higher up the scale than even the maximum value on the conservative plot. The diagram also makes clear some other things, such as the fact that Labour constituencies seem to have a much wider range of unemployment rates, shown by a very large distance between the minimum and maximum values as well as a large interquartile range. The Conservative plot makes it clear that, for at least this sample, Conservative constituencies are for more likely to just be found in areas of low unemployment, probably because they are more appealing to richer voters which it is unlikely that you would find in an area with a high level of unemployment. It seems therefore that they have voters in a smaller range of unemployment rates because of this, and perhaps Labour got as many seats as they did because they seem to appeal to a wider range of economic backgrounds that the Conservative party does and therefore they ended up with more constituencies.
Conclusion
From this investigation, I have gathered evidence to back up the statements I made in the hypotheses and both of these statements now have some proof behind them, perhaps the second one more so than the first. It has been shown that from the evidence we collected, there is a negative correlation between the Unemployment Rate and the Turnout to the elections, which although is different from what I originally thought would happen, is reasonably secure in what it says, though perhaps a larger sample could be used in the future to find out more. The further investigation very clearly showed that my hypothesis was correct as it unmistakably displayed that the Labour constituencies had much higher unemployment rates on average, as well appealing to a larger variety of unemployment rates than the Conservatives who seemed to do best in constituencies where the unemployment rate was relatively low.
In the future it would be possible to do further investigations leading on from these ones which could make even more judgments on the factors that assess turnout and result of elections. These investigations could be repeated, but instead of using unemployment as a scale, house ownership could be used instead to see if you are more likely to turn up to an election if you own your own house, and also whether areas with large percentages of homeowners are more likely to vote for Labour or Conservative. If further data could be found, investigations could be made into whether people of certain ages or backgrounds are more or less likely to turn up to elections.
All of this information could probably at some point be useful to someone. If the government wanted to increase turnout to elections, from this evidence they can see that if they appeal more to the unemployed, they may get a higher turnout. Also, parties could see which sort of groups are voting for them the most, and find a way to gain wider support without losing that which they already have.