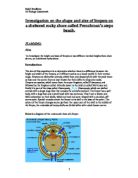
Discussion:
The limpets were mostly present in the upper shore and a little in the middle shore. Most animals were present in the upper shore; however most of the plants were next to the water in the lower shore.
This experiment is not very reliable though, because if the animals were hidden under the stones, you would not consider them. However, for a basic knowledge of the distribution of these organisms, it would be all right.
Looking at this experiment, I reckon it would be suitable to look at the limpets in the lower/middle shore and the upper shore in my investigation.
Apparatus
- 1m ruler
- 30m tape
- block of wood with an arrow made of plastic nailed on to it
- calculator
- calliper
Method
- First, I have to pick up the apparatus and go down to the Frenchman’s steps.
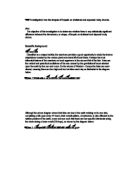
- The block of wood, which is rectangular, has a plastic arrow on the side. The arrow is attached to the block by a nail, so it can move freely. Now using this block of wood and a 1m ruler, I am going to determine the height from chart datum on the shore. So for example, if the tides are 2.74m high and I want to measure the limpets at a height of 4m – I will have to place the block once at 1m and once at 0.26m (reading the bottom of the block). The diagram 1 below clarifies how to use this apparatus. To go onto the next seashore level, in this case 7m, I have to start all over again.
- After I have determined the seashore level, I will place the 30m tape across that point. I will make sure that the tape lies straight on the ground using some stones (see diagram 2).
- In order to get 20 samples in that vertical plane, I will generate 20 random points using my calculator. Using the numbers, I will measure the limpets on these points on the tape.
How to use the random mode on a calculator:
-
Type in 30, since the tape only goes up to 30m
-
Press the Ran# button
-
Then press the = button
- Use this number to measure the limpet on the tape
- To measure the width of a limpet, I will simply use the top of a calliper. However to measure the height of a limpet, I will have to use the bottom, since it is easier and is still the same as using the top (see diagram 3). The measurements will be in mm.
- My data is going to be quantitative, since the observation, which I will make, is going to produce numbers. Therefore, I will record the measurements in an appropriate results table.
- Then using my results, I will draw a bar chart and a scattergram which will hopefully show the difference between the shape at the two levels
-
In order to reject my null hypothesis, I have to prove the difference mathematically. I will do this by using the “t-test”, which will include working out the mean, variance and the “t” value.
Independent and Dependent Variable
When experiments are performed, care must be taken to manipulate or change only one condition and keep all other conditions in the experiment the same. The condition that is manipulated is known as the independent variable. The conditions that are kept the same are known as constants. The dependant variable is any change that results from manipulating the independent variable. You can only know that the independent variable caused the change in the dependant variable if they keep all other factors the same in an experiment.
The independent variable in this experiment is going to be the two different heights at Frenchman’s steps. I am going to measure the limpets at 4m and 7m using the calliper. I will keep the following factors constant:
- Type of shore
- Location of limpets; I will only take into account the limpets which are attached to a rock and exposed to air (not the ones in rock pools)
I can also measure the limpets at two different shores (eg. Sheltered rocky shore and exposed shore), but keep the zone level constant. However, this would totally be a different experiment.
The dependent variable in this experiment will be the change in shape of the limpets. This will be done by measuring the height and width of the limpet and then divide the height by the width in order to get the ratio. This would allow me to compare the ratios at different levels. I will take 20 samples in each case.
Risk Assessment
I will consider the following safety aspects in my experiment:
- Walk slowly and carefully on the sheltered rocky shore
- Being careful where I step on, since I do not want to harm any organisms
- Handle the limpets with great care
- Wear gloves, Wellington boots and waterproof clothes, if it rains
Hypothesis (H1)
The limpets will have a lower mean height/width ratio on shores more exposed to wave action. The following things could explain this: In sheltered areas, limpets tend to be flattened but in exposed areas with wave action, they are more domed. The reason is complex and indirect. One might think that flattened ones would have the advantage of streamlining. In fact, it is probably the wave affect causing more muscles to develop, stronger shells to form and a clamping down on the rock for longer, giving less chance for shell material to form on the outside rim.
Null Hypothesis (H0)
There will be no difference between the means at different zones in a sheltered rocky shore.
Results
T-Test on Limpet Data
I used the following method to work out the “t” value:
-
First work out the mean of x1 and x2 by dividing the total of x (Σx) by n (the number of samples)
- Then work out the variance using the following steps:
- square the total of x and then divide by n
-
subtract that value from the total squared x (Σ(x)2)
- then divide that value from n -1
- Now work out the “t” value using the following steps:
-
Subtract the second mean (x2) by the first mean (x1); now because there is a mod sign (¦¦), you only take the positive value into account – we will call this value ‘Y’
- now divide both variances by n and add them together; this value has to be square rooted
- then divide Y by the square rooted value
All the answers are in 3sf, except for the “t” value, which is in 3dp.
Conclusion
Having calculated the “t” value, the next step is to compare this answer with a critical value from a statistical table.
The critical value from the ‘t’ table [P= 5%; DF= 38] = 2.042.
- DF means the degrees of freedom and in this case taken as 20+20-2=38, which is one less than each of the limpet totals. If you look at the table below, you can see that I have taken the DF as 30, since you always round the number down if it is not present in the table. This is to make sure that my results meet the minimum demand.
- P is the significance level and 5% is the level normally used in biological investigations. When we reject the null hypothesis at the 5% level, we will be correct in doing so 95% of the time.
Because my calculated “t” value of 3.658 is greater than the critical “t” value of 2.042, I can reject the null hypothesis at the 5% significance level. Therefore, accept the alternate hypothesis that there is a difference between the mean height/width ratios of limpets on a sheltered rocky shore receiving different amounts of exposure to wave action.
When I was carrying out the experiment, I noticed that the limpets in the middle were slightly smoother than the ones in the upper shore, indicating that the wave action had an effect on them.
From the results shown in the results table and the graphs, I can conclude as you go further up the shore the limpets tend to get taller and the base gets shorter, which means that the height/width ratio also increases.
Looking at the bar chart, I have noticed that there is a low number of limpets at 4 metres, which have a high height/width ratio or rather a big shape. However at 7 metres, I also found some big limpets. The reason for this could be due to the different amount of wave action at the different levels.
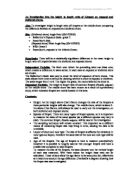
At the middle shore (4m), there is slightly more wave action, so the risk of the limpet being washed away is high. Therefore it has to have more muscle spread over the rock, to clamp down on it for longer - the flatter limpets are ideal for this. The following diagrams will explain this more clearly:
Limpets, which live in or near the water, are usually relaxed, so they hang on to the rock with their legs and as they grow, the shell grows outwards from beneath - becoming flat. However the limpets, which live on the upper shores, are mostly attached to rock by their muscles. So because there is no space to grow from beneath, the shell just grows upwards - becoming pointy.
I have also drawn two scattergram for the limpets at 4m and 7m. This is to show how the limpets look at the different levels. The graph for the limpets at 4m has a positive correlation, so I can assume that the width is nearly proportional to the height. Whereas the graph for the limpets at 7m has no correlation, since the points are scattered to right side. This indicates that the limpets grow in different ways at the upper shore, perhaps due to the lack of water.
The scientific way of explaining why there is a change in shape would be as follows. A big opening will render the limpets more vulnerable to desiccation. This might not be a major problem on lower/middle shore, where there is continuous spray. However on upper shore it could be a more important factor.
Possession of a large foot and a (relatively) small shell will be an advantage for holding on to the shore but will render you more vulnerable to predators like shore crabs. They will be able to access your dangly bits by attacking your large operculum (thinner than the rest of the shell). This will not be much of a problem on the lower/middle shores because shore crabs do not thrive in exposed conditions and few will be found there. A shorter, more rounded shape (as you tend to find on exposed shores) will be easier for other predators like gulls to swallow.
Evaluation
Overall, I believe that my experiment was carried out in an orderly fashion. However, there is always space for improvement. The main area I believe I could have gained more accurate results was if I used something different from a calliper to measure the limpets. This is because it was quite difficult to measure the height of the limpet when the ground was bumpy. This could have caused an increase or a decrease in my results. I personally think that the block of wood with the plastic arrow was not accurate at all. I am saying this because if you stand at one point and measure the height you will find 4m.
However if you move 1m to the right and measure the height again, you will see that it is slightly higher or lower than 4m. This is caused by the sheltered rocks.
In my data, I have one clear anomalous result, which I have pointed out on graph no.2. This anomalous result could have been caused by the unknown boundaries for the upper/middle/lower shores. But this problem can be easily solved by doing a continuous belt transect before starting the experiment. Although I did do one the day before (see preliminary work); however it would have been more helpful to do it on the day.
Even if there are some limitations, they would unlikely overturn highly significant results.
After all this said, I personally think that my data is very good, since I have proven this with the “t” test, graphs and theories.
Bibliography:
- Internet for introduction
- A2 AQA Biology (Spec A) by Baker, Indge, Rowland
- Collins Advanced Science by Mike Boyle